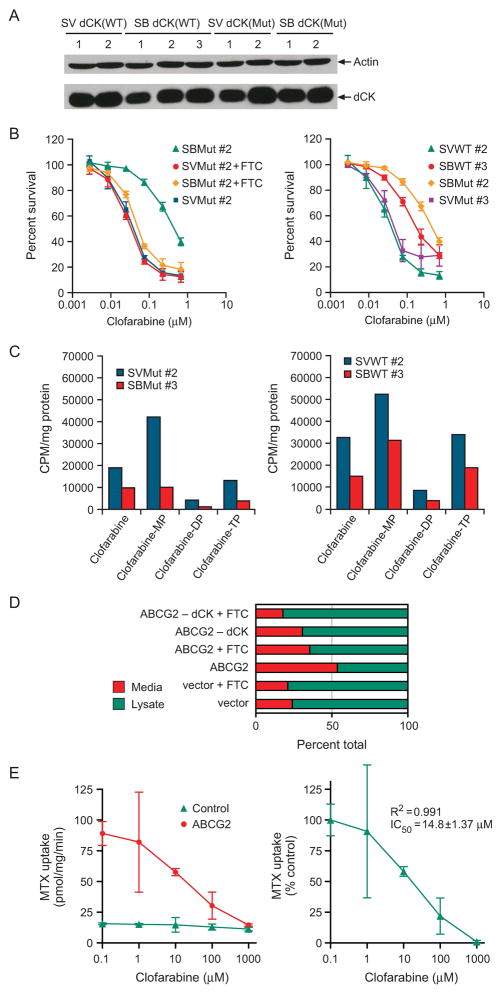
Figure 4. ABCG2-mediated efflux is greater in cells expressing mutant dCK than in cells with enhanced dCK expression.
A, A representative immunoblot analysis of wild-type (WT) and mutant (MT) dCK in vector-control (SV) and ABCG2-expressing (SB) Saos2 cells. B, Survival of Saos2 vector- or ABCG2-transduced cells expressing mutant (MT) or wild-type (WT) dCK. The values are the average of three-independent experiments performed in triplicate. The bars represent one standard deviation. C, Clofarabine metabolites were determined by HPLC. Arabic numerals (#) indicate individual cell pools; D, Efflux of clofarabine was determined from the ratio of the proportion of drug in the media after a 60 min efflux period and the proportion of drug within the cell. This is a representative of an experiment repeated three times with similar results. E, Various concentrations of clofarabine were added to vesicles expressing either no ABCG2 or ABCG2 and 10μM [3H] methotrexate the values are means of triplicate determinations from a representative experiment.

