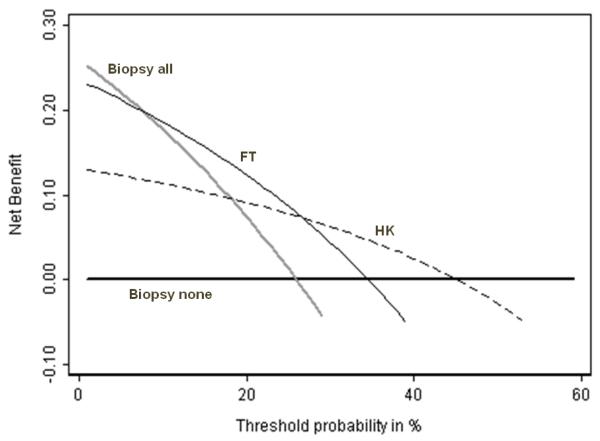
Figure 1. Net benefit against plotted against threshold probabilityfor molecular markers of prostate cancer.
Grey line: biopsy all men. Thick black line: biopsy no men. Thin black line: biopsy if FT test positive. Dashed line: biopsy if HK test positive. The optimal strategy is to biopsy all men if the threshold probability is below 10%; biopsy on the basis of FT is threshold probability is 10 – 25%; biopsy by HK if threshold probability is 25 – 45% and biopsy no man if threshold probability is greater than 45%.

