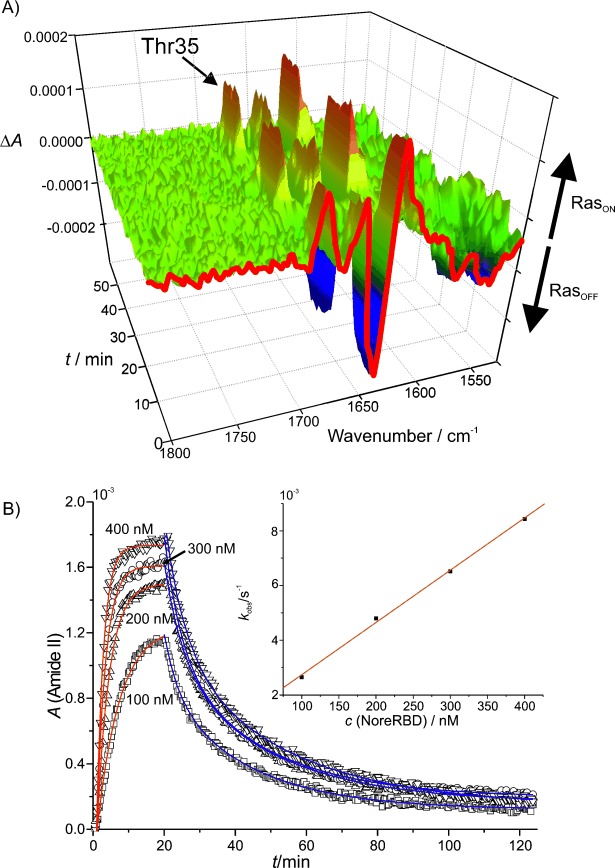
Figure 5.

A) By simple buffer exchange, difference spectra are obtained. Here, the interaction of Ras⋅GDP with a small molecule (BeF3−) is shown. This molecule mimics the γ-phosphate and switches Ras into its “on” conformation as seen by the absorption of the marker band for the “on” state, the carbonyl vibration of Thr35.[28] Repetitive changes between buffer with and without BeF3− enable repetitive switching of the protein. B) Protein–protein interactions can be studied in a manner similar to surface plasmon resonance, but with the additional chemical information of the FTIR spectrum. Here, the association and the dissociation of NORE1A from Ras is shown. The raise can be fitted by a single exponential function. The plot of the time constant kobs against the NORE1A concentration (inset) revealed the KD.
