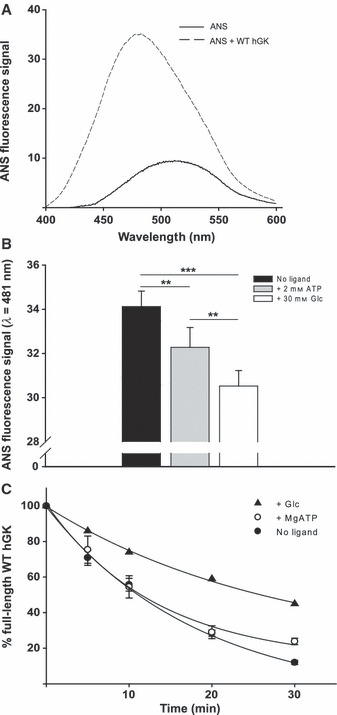
Figure 3.

ANS fluorescence measurements and limited proteolysis. (A) Emission fluorescence spectra (λex = 385 nm) of free ANS in buffer and ANS in the presence of 0.75 μm WT hGK. A final ANS concentration of 60 μm was used. (B) The effect of ATP and Glc on ANS binding to WT hGK. The ANS binding experiments were performed at a temperature of 38 °C, as described in Experimental procedures, with 60 μm ANS and a protein concentration of 0.75 μm. The concentrations of Glc and ATP were 30 mm and 2 mm, respectively. Each column represents the mean ± SD of three independent experiments. Statistical significance was determined with Student’s t-test: **P < 0.01 and ***P < 0.0001. (C) Time-course for the limited proteolysis of WT hGK by trypsin. WT GST–hGK (0.5 mg·mL−1) was cleaved with factor Xa for 2 h at 4 °C, and subsequently subjected to limited proteolysis by trypsin at 25 °C (trypsin/hGK ratio of 1 : 400 by mass) in the absence of ligand (•), or in the presence of either 40 mm Glc (▴) or 2 mm ATP/4 mm MgAc (○). Data points and error bars represent the mean ± SD of three independent experiments.
