
Figure 6.
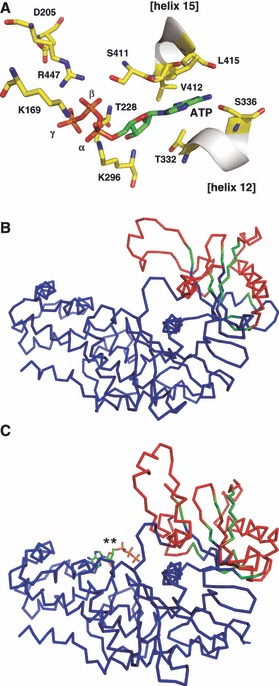
The ATP-binding site in the MD simulated model structure of the binary hGK–ATP complex and the domain motion induced by ATP binding to the hGK apoenzyme. (A) Close-up view of the ATP-binding site in the MD simulated model structure of the binary hGK-ATP complex, showing the main contact residues with ATP; for a presentation of all contact residues, see Table S1. For helix nomenclature, see [47]. (B, C) The domain motion induced by ATP binding to the apoenzyme with partial closure of the active site cleft and a rotation angle of ∼ 33°. The coordinates were those obtained for (B) the modelled super-open conformation, including the Glu157–Asn179 loop, and (C) the modelled open conformation with inserted ATP (GK–ATP). The Cα rmsd values were 4.01 Å for the whole protein, 2.09 Å for the fixed domain (349 residues), and 3.91 Å for the moving domain (87 residues). The dynamic domains were identified with the dyndom program [30]. The Cα backbone structures, shown in line presentation, were colour-coded as follows: blue, fixed domain; red, moving domain; and green, connecting residues. For comparison, the corresponding data for the domain motion induced by Glc binding to the apoenzyme are shown in Table S2. **ATP.