Table 2.
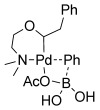
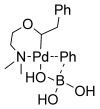
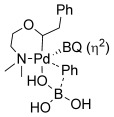
Comparison of the free energies of the postulated transmetallation TSs.
| TS | Complex | ΔG[a] [kJ mol−1] |
|---|---|---|
| TS-f |  |
111 |
| TS-g |  |
117 |
| TS-h |  |
105 |
| TS-i |  |
85[b] |
Comparison of the free energies of the postulated transmetallation TSs.
| TS | Complex | ΔG[a] [kJ mol−1] |
|---|---|---|
| TS-f |  |
111 |
| TS-g |  |
117 |
| TS-h |  |
105 |
| TS-i |  |
85[b] |