Figure 2.
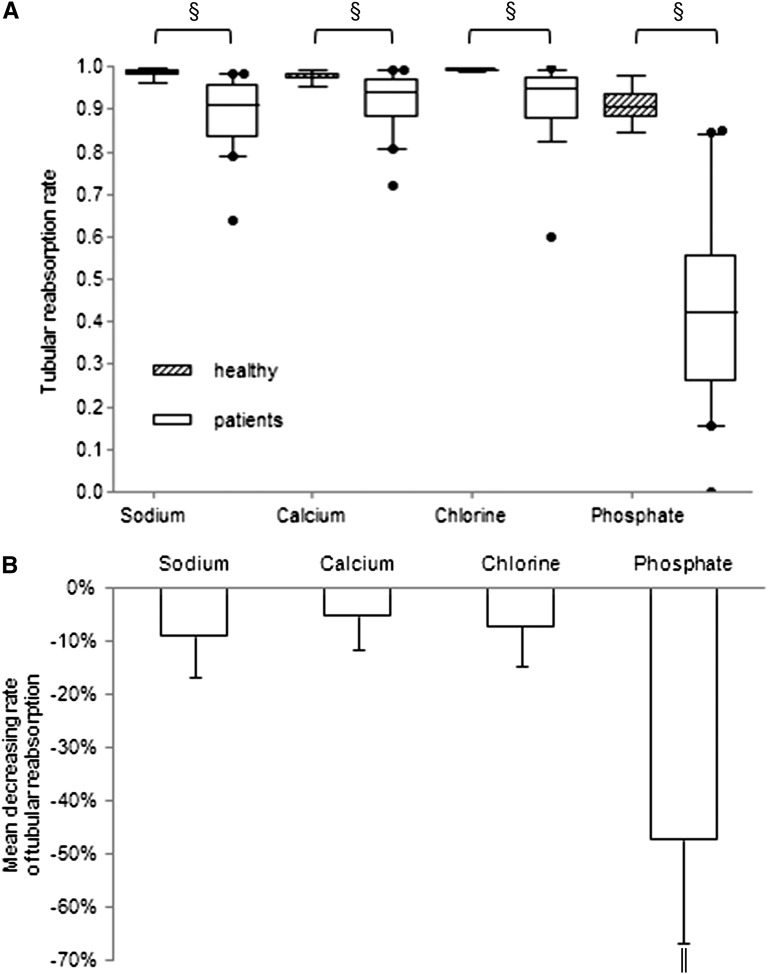
Tubular reabsorption of electrolytes in MHD patients with high urinary output. (A) Renal tubular reabsorption rates of sodium, calcium, chlorine, and phosphate in MHD patients and healthy controls. Boxes represent the interquartile range, with the upper and lower edges representing the 75th and 25th percentiles, respectively. The central horizontal lines represent the median levels. The vertical whiskers above and below the boxes represent the range of 5%–95% percentiles. Circles beyond the whiskers represent severe outliers. §P<0.001 versus control. (B) Percentage decrease in the rate of electrolytes in MHD patients. ∥P<0.001 comparison of phosphate with sodium, calcium, or chlorine.

