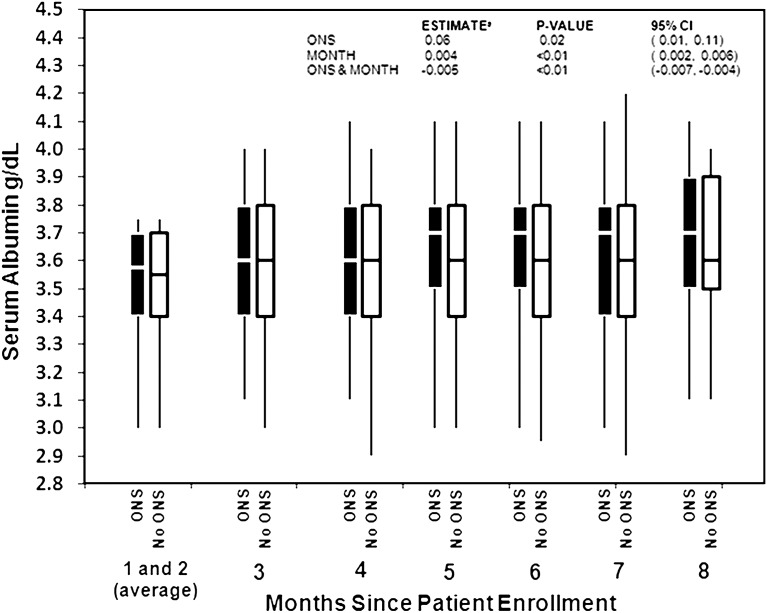
Figure 1.
Mean serum albumin (g/dl) by month of enrollment, among patients with indication for ONS. Boxes denote the 25th to the 75th percentiles, lines denote the median value, and bars denote the 5th and 95th percentiles. aEstimates of the effect of ONS and month on serum albumin were calculated using a linear mixed model that included ONS at baseline, month of enrollment, and the interaction between ONS and month of enrollment. ONS, oral nutritional supplements; 95% CI, 95% confidence interval.

