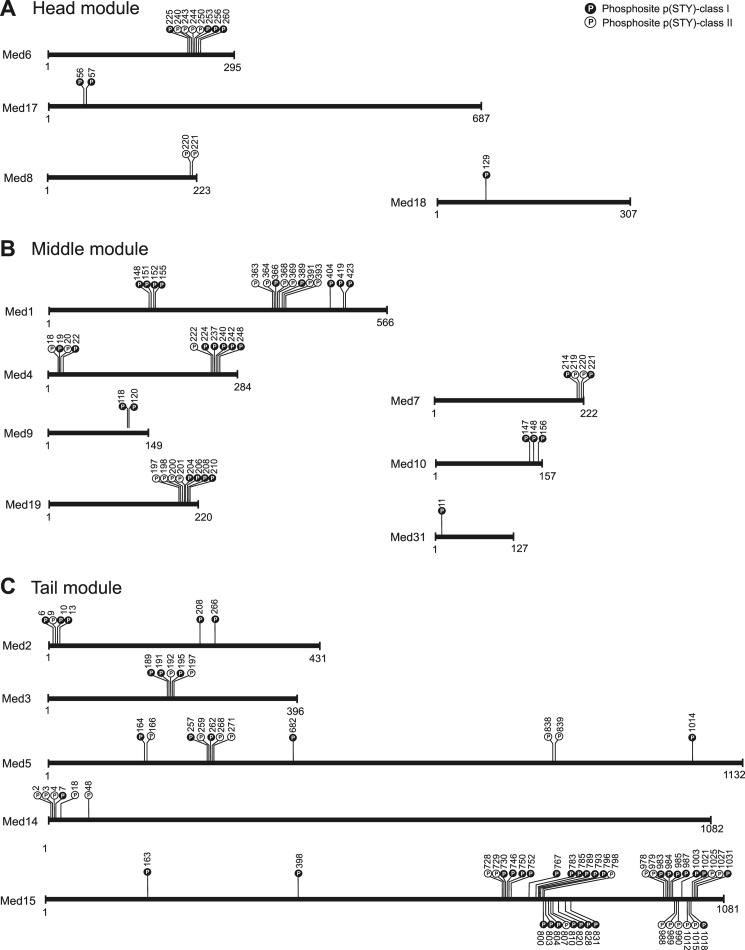
FIGURE 2.
Distribution of phosphorylation sites in Mediator subunits. A–C, schematic illustration of phosphosite positions on the primary structure of Mediator subunits belonging to the head (A), middle (B), and tail (C) modules. Phosphosites classified in p(STY)-class I (high localization probability) are highlighted in black and p(STY)-class II (medium localization probability) in white, respectively.

