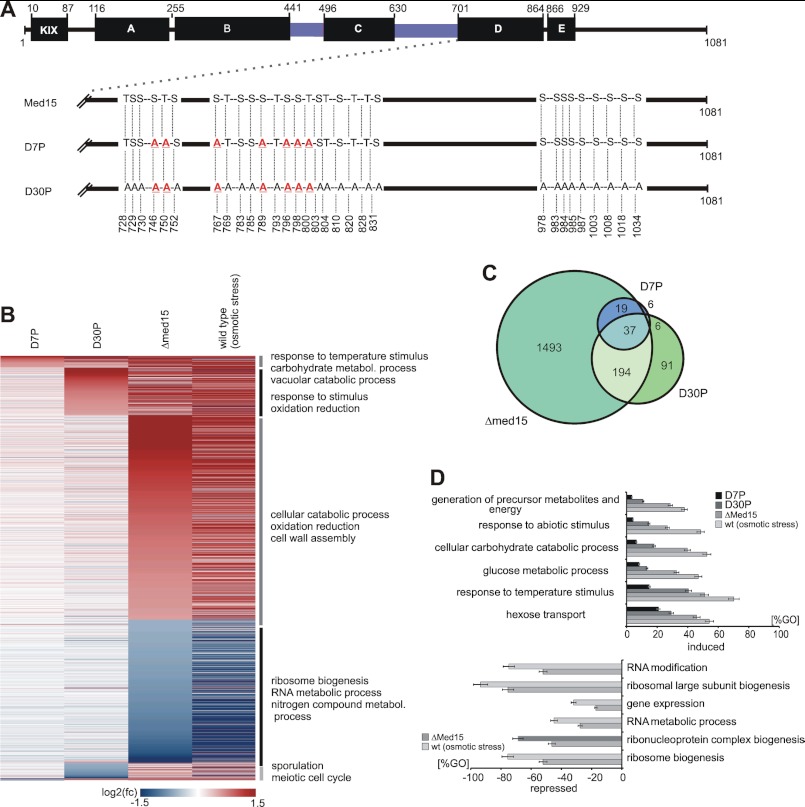
FIGURE 4.
Effect of mutated phosphosites on global gene expression under normal growth conditions. A, functional organization of ScMed15. Med15 is organized in several regions as described previously (KIX-domain; A–E; black bars, which interact to different transcription factors (14, 82), Msn2 (77), Gal4 (84), Gcn4 (82, 85), Pdr1 (13, 15), Oaf1 (13)). Q-rich regions are colored blue. Mutant sequence features are shown below. The D7P mutant harbors genomic point mutations of the seven serine and threonine positions to alanine, which are dynamically phosphorylated during response to high salt concentrations. The D30P mutant harbors the complete set of all 30 phosphosites (identified during this study), which mimic the dephosphorylated state of the Med15 C terminus. B, heat map illustrating the effect of the mutated phosphosites on global gene expression (labeled mRNA fraction, 6 min labeling time). The genes are arranged by the highest induction or repression fold changes in order of D7P, D30P, and Δmed15. The horizontal lines represent genes, which are differentially expressed at least 1.5-fold in at least one of the data sets. Red indicates genes, which are induced compared with the wild-type control. Blue indicates repressed genes. Genes were ranked by highest/lowest fold-change in order of D7P, D30P, and Δmed15. C, Venn diagram illustrating the overlap between the data sets of D7P, D30P, and Δmed15. D, diagram representing enriched GO terms ranked by Fisher's exact test. Upper diagram, the bars represent the percentage of genes induced in the D7P (black), D30P (dark gray), and Δmed15 (middle gray) strains relative to all genes in the GO term. Lower diagram, the bars represent the percentage of genes repressed in the D7P (black), D30P (dark gray), and Δmed15 (light gray) mutant relative to all genes in the GO term.

