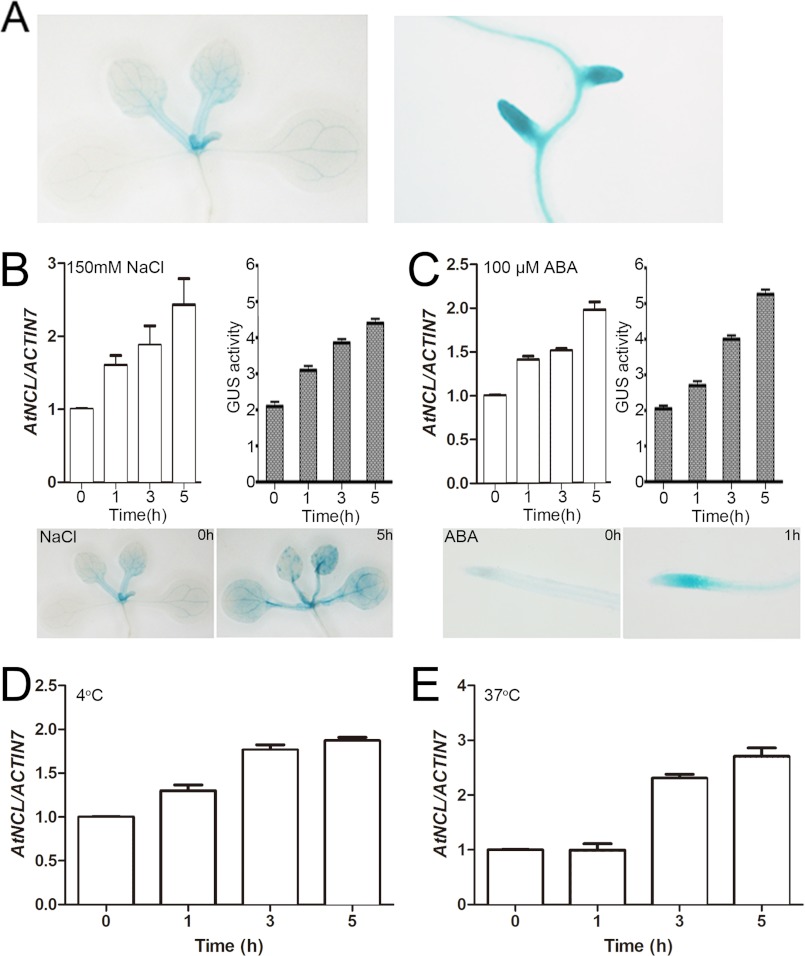
FIGURE 5.
AtNCL expression under normal conditions and in response to stress. A, GUS staining of AtNCL::AtNCL cDNA-GUS transgenic seedlings under normal growth conditions. B, qRT-PCR and GUS assay of seedling exposure to 150 mm NaCl. C, qRT-PCR and GUS assay of seedling exposure to 100 μm ABA. D, qRT-PCR assay of wild-type seedling exposure to 4 °C. E, qRT-PCR assay of wild-type seedling exposure to 37 °C.

