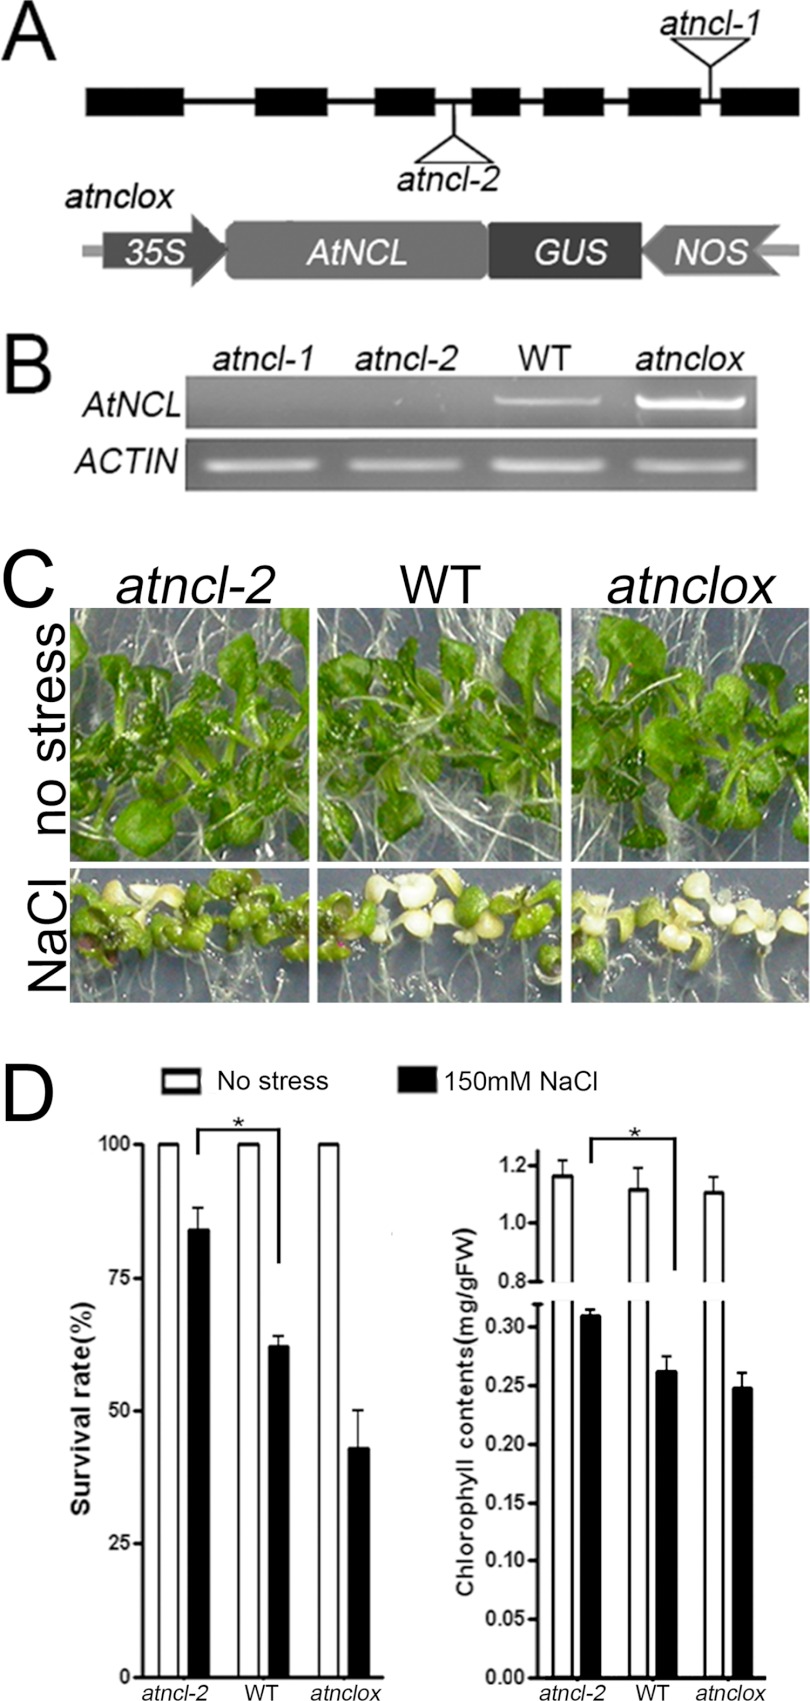
FIGURE 6.
Functional analysis of AtNCL in plant. A, plant materials. The upper panel shows a diagram of AtNCL with triangles representing the sites of the T-DNA insertions in atncl-1 and -2. The lower panel shows the construction of the overexpression vector. Full-length AtNCL cDNA was cloned into pCAMBIA1300 under control of the CaMV 35S-promoter with a NOS terminator and GUS as the reporter gene. B, RT-PCR analysis of total RNA extracted from the seedlings at 10 days after germination. ACTIN7 was amplified as an internal control. C, growth phenotypes of seedlings grown on 1/2 MS containing 150 mm NaCl for 7 days beginning at 7 days after germination. D, survival rate and chlorophyll content after 7 days of salt stress. Seedlings without salt stress were used as a control. The test was performed at least three times using Prism 4 (n = 30). The columns show the mean value plus the S.E. (error bars). Those pairs for which p < 0.05 are marked with an asterisk.

