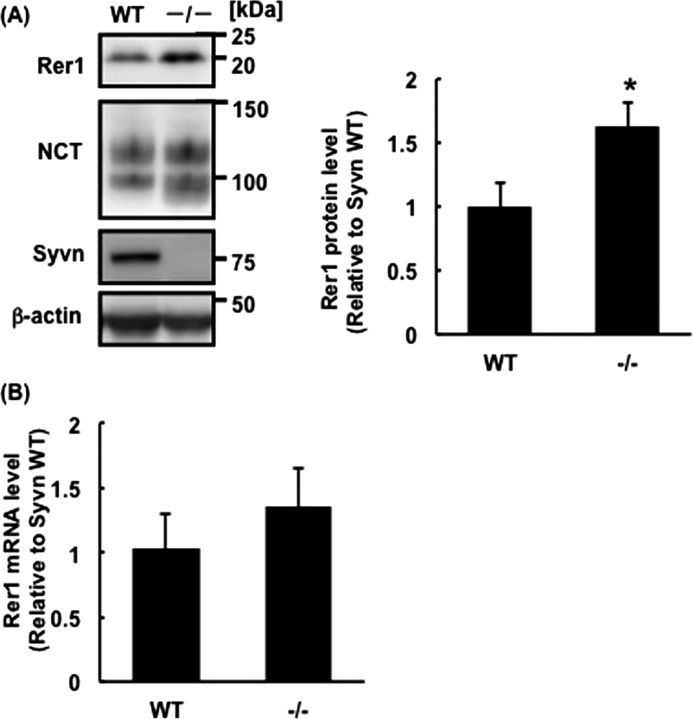
FIGURE 2.
Rer1 levels are elevated in Syvn−/− fibroblasts. A, Western blot analysis of lysates prepared from WT and Syvn−/− fibroblasts with the indicated antibodies. Twenty micrograms of protein was loaded in each lane, and β-actin served as a loading control (left panel). Quantitation of Rer1 levels from three independent experiments as shown in the left panel (right graph). Values are expressed as mean ± S.D. *, p < 0.05 (two-tailed Student's t test). B, quantitative real-time PCR analysis of Rer1 mRNA levels in WT and Syvn−/− fibroblasts. Values are expressed as means ± S.D. from four independent experiments. p = 0.24.

