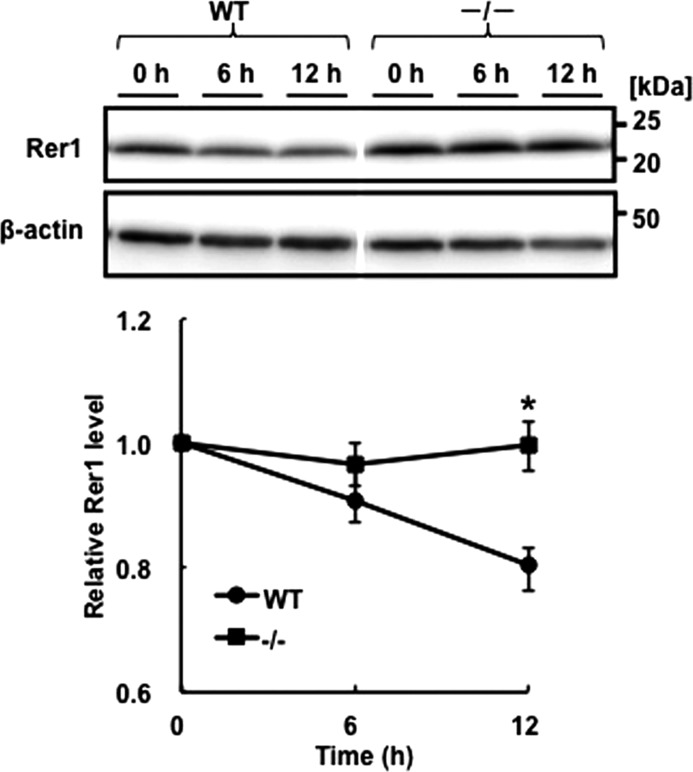
FIGURE 3.
The stability of Rer1 in WT or Syvn−/− fibroblasts after cycloheximide treatment. WT or Syvn−/− fibroblasts overexpressing hRer1 were treated with 50 μg/ml cycloheximide for 0, 6, or 12 h. Rer1 levels in the lysates were determined by Western blotting with an anti-Rer1 antibody (upper panel). Five micrograms of protein was loaded in each lane, and β-actin served as a loading control (lower panel). Quantitation of Rer1 levels from four independent experiments shown in the upper panel is presented by the graph below the blots. Values are expressed as means ± S.E. *, indicates statistical significance of the differences between the cell line data on the basis of a two-tailed Student's t test and p < 0.05. The space between the blots indicates that they were assembled from different areas of the same blot.

