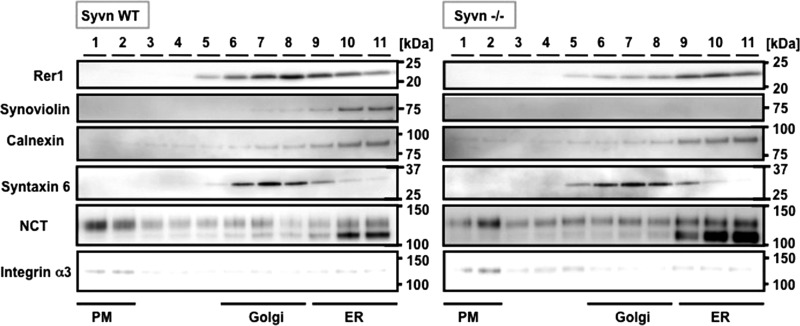
FIGURE 6.
Subcellular fractionation of Rer1, Syvn, and NCT in WT and Syvn−/− fibroblasts. The numbers above the lanes represent the fractions of the gradient separation from the top to the bottom of the tube. Equal volumes of each fraction were analyzed by Western blotting with the indicated antibodies. Calnexin, syntaxin 6, and integrin α3 are the ER, Golgi, and PM markers, respectively.

