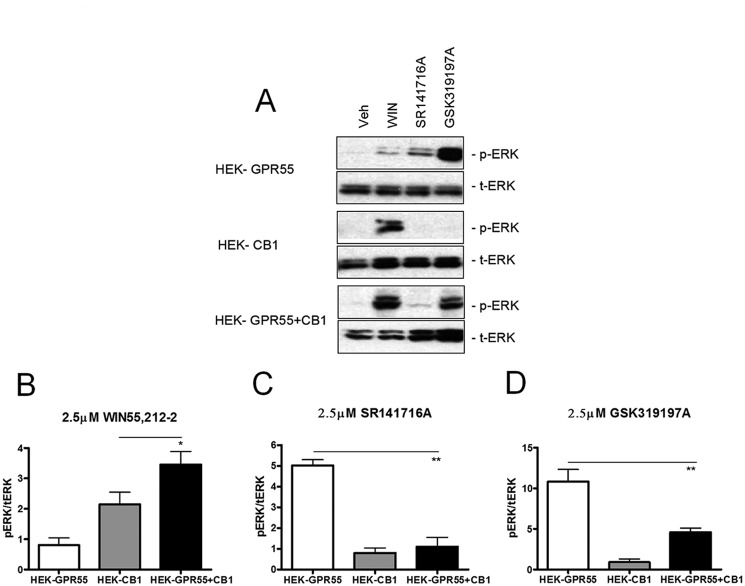
FIGURE 4.
ERK1/2 phosphorylation state is altered in HEK-GPR55+CB1 cells. HEK-GPR55 (white bars), HEK-CB1 (gray bars), and HEK-GPR55+CB1 cells (black bars) were serum starved overnight and stimulated with vehicle, 2.5 μm WIN55,212-2 (A and B), 2.5 μm SR141716A (A and C), or 2.5 μm GSK319197A (A and D) for 25 min. Cell lysates were resolved on a 12% SDS gel followed by antibody staining. Control stimulation with vehicle shows baseline pERK1/2 levels in single and double expression cell lines and the corresponding total ERK levels (t-ERK) are presented below the phospho-ERK (pERK) bands (A). WIN55,212-2 (A and B) induces ERK1/2 phosphorylation in HEK-CB1 and HEK-GPR55+CB1, but not in HEK-GPR55 cells. pERK1/2 levels were significantly increased in HEK-GPR55+CB1 cells compared with HEK-CB1 cells. The stimulation with 2.5 μm SR141716A (A and C) or 2.5 μm GSK319197A (A and D) mediates ERK1/2 phosphorylation in HEK-GPR55, but ERK1/2 phosphorylation is significantly reduced in HEK-GPR55+CB1 cells. A representative blot of three independent experiments is shown A. Blots show the mean ± S.E. from three independent experiments, whereby pERK1/2 bands were normalized to total ERK1/2 levels using densiometric analysis. *, p < 0.05; **, p < 0.01.

