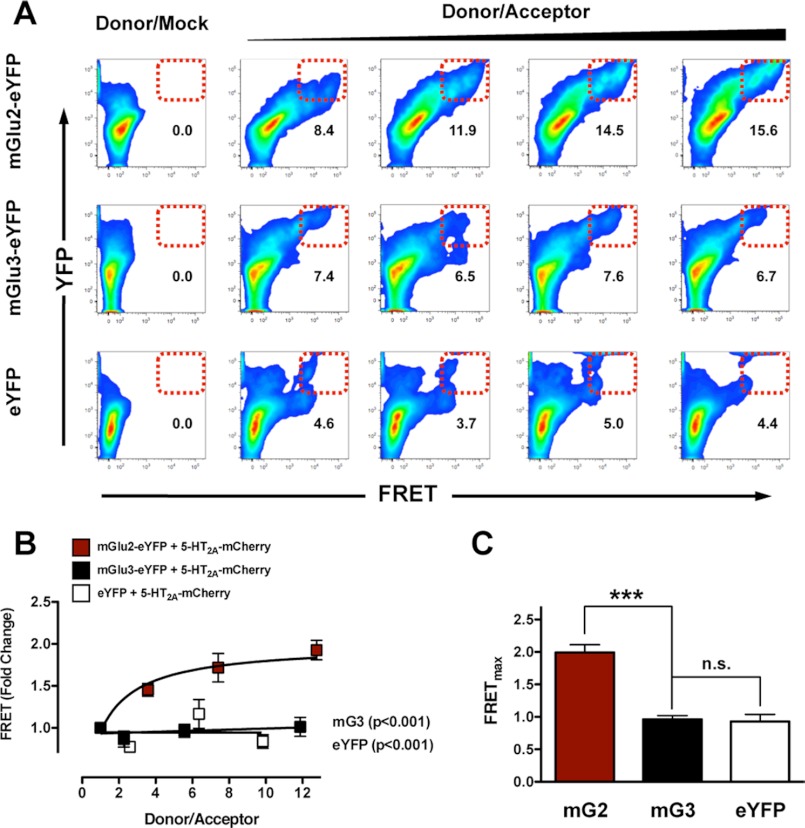
FIGURE 4.
Measurement of molecular interactions between 5-HT2A and mGlu2 receptors by FCM-based FRET assay. A, representative flow-cytometric analysis of FRET between mGlu2-eYFP (donor) and 5-HT2A-mCherry (acceptor). Increasing amounts of mGlu2-eYFP were co-expressed with a constant amount of 5-HT2A-mCherry in HEK293 cells. The specificity of mGlu2-eYFP and 5-HT2A-mCherry interactions was assessed by comparison with co-expression of mGlu3-eYFP and 5-HT2A-mCherry, and eYFP and 5-HT2A-mCherry. The red boxes outline the gate in which FRET signal was seen. Numbers represent percentage of cells within the indicated gates. B, fold change of FCM-based FRET signal for each combination of eYFP- or mCherry-tagged receptors. Only the data obtained in cells co-expressing mGlu2-eYFP and 5-HT2A-mCherry can be fit preferably by a saturation curve, assessed by F test. The other co-transfection datasets show linear correlations (n = 3–8). Note that mGlu3 or eYFP decrease the FCM-based FRET signal as compared with mGlu2: mGlu2-eYFP + 5-HT2A-mCherry compared with eYFP + 5-HT2A-mCherry, F(2,37) = 21.58, p < 0.001; mGlu2-eYFP + 5-HT2A-mCherry compared with mGlu3-eYFP + 5-HT2A-mCherry, F(2,41) = 27.96, p < 0.001. C, FRETmax obtained from individual FCM-based FRET saturation curves. ***, p < 0.001; n.s., not significant; Bonferroni's post hoc test of one-way ANOVA. Error bars represent S.E.

