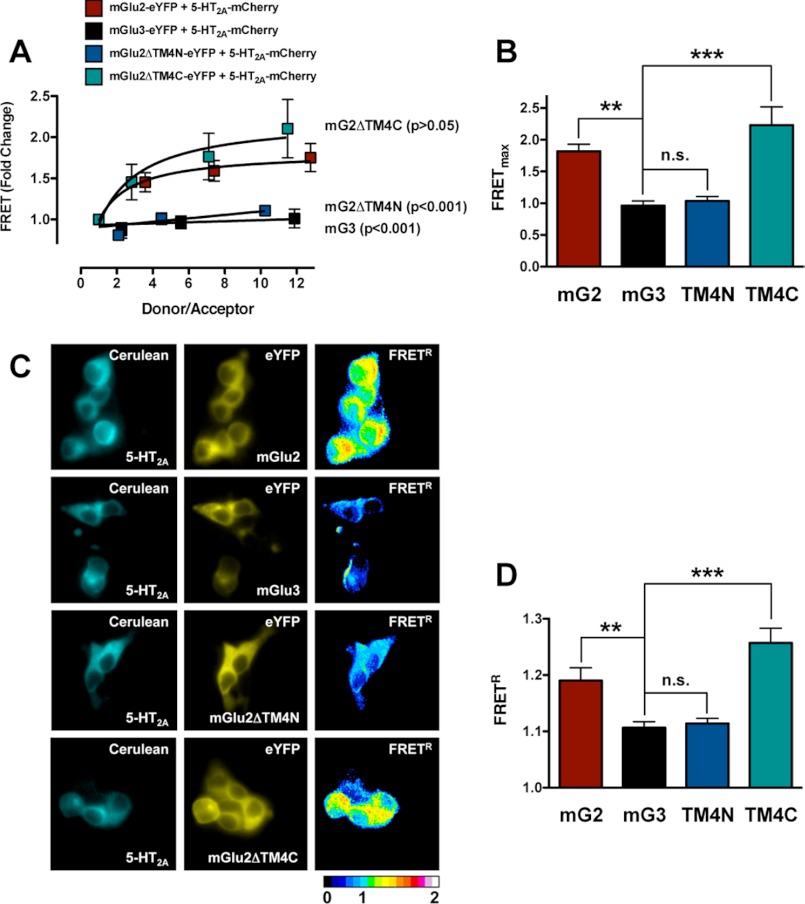
FIGURE 5.
Three residues located at the intracellular end of TM4 of mGlu2 mediate complex formation with the 5-HT2A receptor. A, fold change of FCM-based FRET signal for each combination of eYFP- or mCherry-tagged receptors (eYFP-tagged, donor; mCherry-tagged, acceptor). Data obtained in cells co-expressing mGlu2-eYFP and 5-HT2A-mCherry or mGlu2ΔΤM4C-eYFP and 5-HT2A-mCherry can be fit preferably by a saturation curve, assessed by F test. Data obtained in cells co-expressing mGlu3-eYFP and 5-HT2A-mCherry or mGlu2ΔΤM4N-eYFP and 5-HT2A-mCherry show linear correlations (n = 4). Note that mGlu2ΔΤM4N or mGlu3, but not mGlu2ΔΤM4C, decreases the FCM-based FRET signal as compared with mGlu2: mGlu2-eYFP + 5-HT2A-mCherry compared with mGlu3-eYFP + 5-HT2A-mCherry, F(2,28) = 29.09, p < 0.001; mGlu2-eYFP + 5-HT2A-mCherry compared with mGlu2ΔTM4N-eYFP + 5-HT2A-mCherry, F(2,28) = 25.21, p < 0.001; mGlu2-eYFP + 5-HT2A-mCherry compared with mGlu2ΔTM4C-eYFP + 5-HT2A-mCherry, F(2,28) = 1.23, p > 0.05. B, FRETmax obtained from individual FCM-based FRET saturation curves. **, p < 0.01; ***, p < 0.001; n.s, not significant; Bonferroni's post hoc test of one-way ANOVA. C, single-cell FRET in live HEK293 cells co-expressing 5-HT2A-cerulean and either mGlu2, mGlu3, mGlu2ΔTM4N, or mGlu2ΔTM4C chimera, all tagged with eYFP (cerulean-tagged, donor; eYFP-tagged, acceptor). Pseudo-color images of FRET signals represent the ratiometric normalization of the FRET signal (FRETR). D, results from a single experiment, representative of three independent studies, are shown. 5-HT2A-cerulean + mGlu2-eYFP (n = 23); 5-HT2A-cerulean + mGlu3-eYFP (n = 16); 5-HT2A-cerulean + mGlu2ΔTM4N-eYFP (n = 21); 5-HT2A-cerulean + mGlu2ΔTM4C-eYFP (n = 21). Significant increases in FRETN signal over control are seen only with co-expression of 5-HT2A and either mGlu2 or mGlu2ΔTM4C. **, p < 0.01; ***, p < 0.001; n.s., not significant; Bonferroni's post hoc test of one-way ANOVA. Error bars represent S.E.

