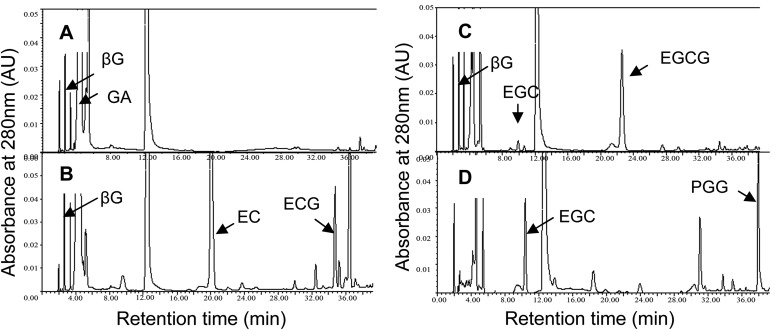
FIGURE 4.
HPLC analysis of UGGT and ECGT enzyme assay extracts. A, the UGGT assay solution was incubated at 30 °C for 1.5 h in a total volume of 1.5 ml containing 50 mm phosphate buffer (pH 6.0), 2.3 mm UDPG, 1.4 mm GA, 4 mm ascorbic acid, 1.5 mm salicylic acid, and crude enzyme extract (0.55 mg of total protein). The product βG was detected clearly in this assay. B and C, the ECGT assay solution was incubated at 30 °C for 1 h in a total volume of 1.5 ml containing 50 mm phosphate buffer (pH 6.0), 0.4 mm nongalloylated catechins (EGC or EC), 0.96 mm βG, 4 mm ascorbic acid, and crude enzyme extract (0.55 mg of total protein). The galloylated catechins EGCG or ECG were detected clearly in this assay. D, the ECGT assay solution was conducted with substrates 0.96 mm 1,2,3,4, 6-pentagalloylglucose (PGG), 0.4 mm nongalloylated catechins (EGC), and conditions otherwise identical to those of the ECGT assay. No galloylated catechins were produced effectively from the substrates 1,2,3,4,6-pentagalloylglucose and EGC. The product peaks of βG in A, ECG in B, and EGCG in C were collected and identified by LC-MS (see Fig. 5). AU, absorbance units.

