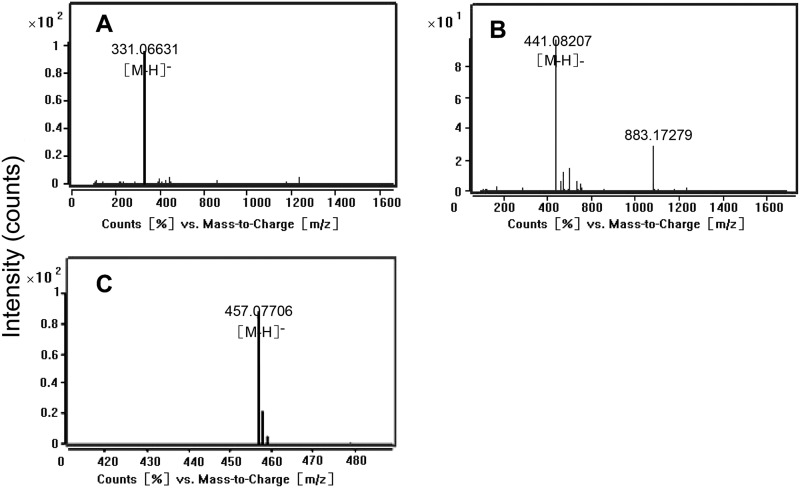
FIGURE 5.
Mass spectra of products in the UGGT, ECGT, reaction assays. A, shown are mass spectra of peaks corresponding to βG in the UGGT enzyme reaction assay (see Fig. 4A). The ions of full MS correspond to the βG standard. B and C, MS assay of products peaks in the ECGT enzyme reaction assay (see Fig. 4, B and C) are shown. The ions of 441 and 457 correspond to galloylated catechins ECG and EGCG standards, respectively.

