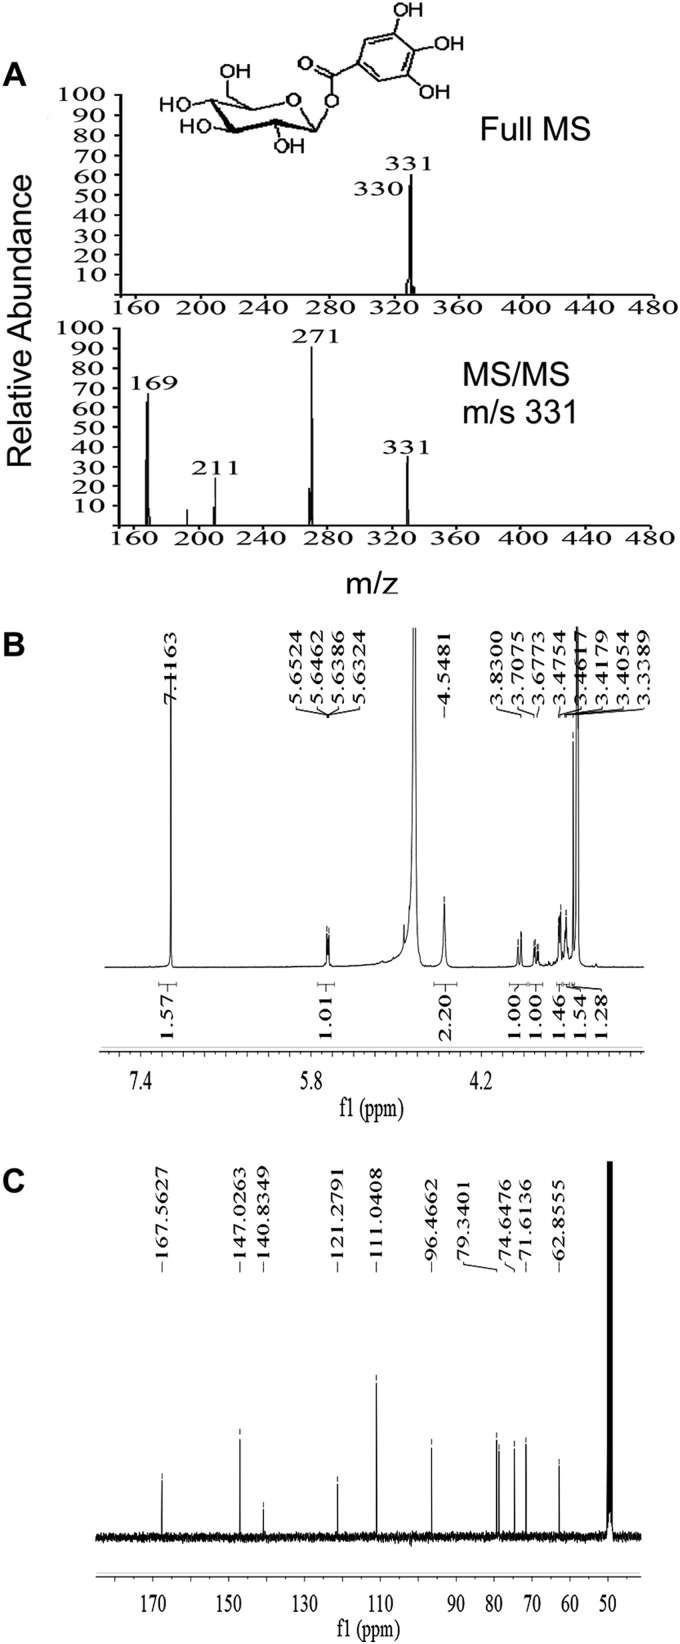
FIGURE 8.
Mass spectrometry and NMR assay of βG in the tea plant. A, shown are mass spectra of the peak corresponding to βG in Fig. 7. B and C, shown are 1H and 13C NMR spectra of the peak corresponding to βG in Fig. 7. 1H and 13C NMR spectra were recorded in methanol-d4 on a Bruker Avance 400 MHz spectrometer with TMS as an internal standard. Chemical shifts were expressed in ppm (δ). The 1H and 13C NMR spectra were consistent with those of the standard. The compound was identified as βG.

