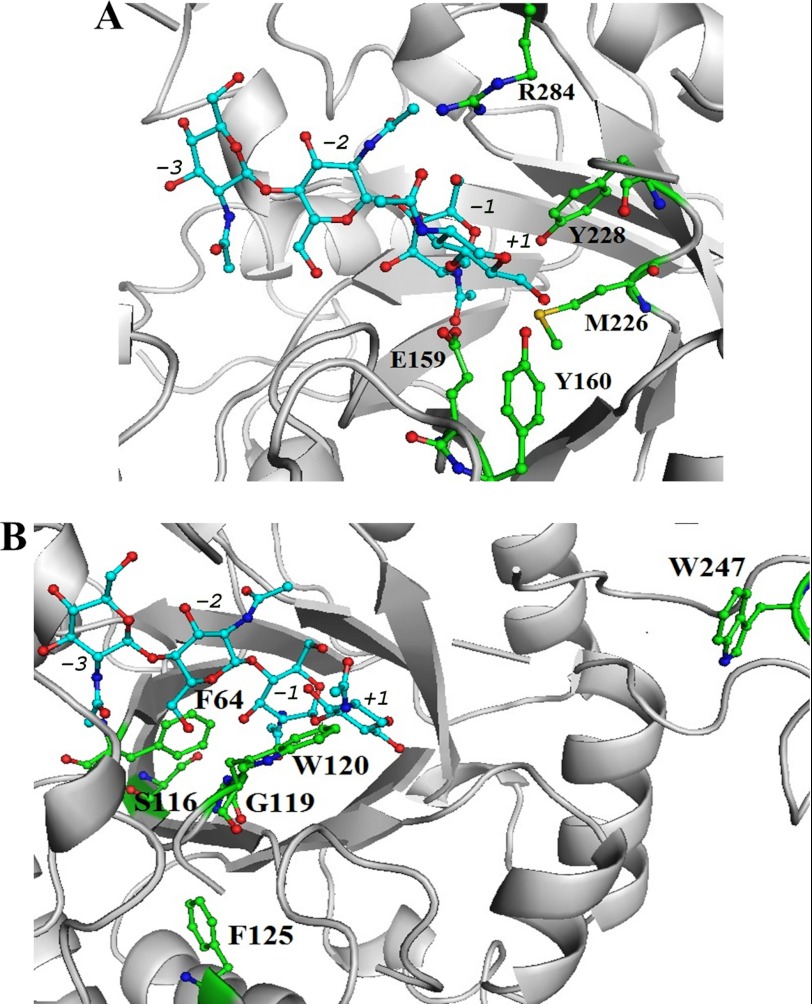
FIGURE 2.
Close-up view of three-dimensional model of SpChiD representing the residues targeted for mutation. A, catalytic center (Met-226, Tyr-228, Arg-284, Glu-159, and Tyr-160). B, catalytic groove (Phe-64, Phe-125, Gly-119, Ser-116, and Trp-120) and one residue at the solvent-accessible region Trp-247. The side chains of residues mutated in this study are shown as sticks and subsites are indicated. Pictures used for representation were made with PyMOL.

