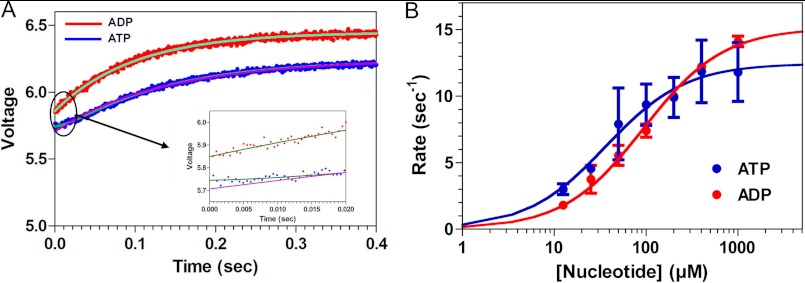
FIGURE 5.
Kinetics of nucleotide-induced movement of the CS. A, a double cysteine K5 construct (A2C,V256C) was labeled with TMR, and a rigor complex of 4 μm TMR-labeled V256C,V365C plus 20 μm MTs was mixed in the stopped flow with ATP (blue jagged curve) or ADP (red jagged curve). For ATP, the resulting fluorescence transient consisted of an increase in fluorescence, implying a separation of the CS from residue 256 in the motor core. However, fitting of this transient to a single exponential rate equation (smooth magenta curve) is inadequate at short time intervals (black oval), and this is illustrated in the inset. Adequate fitting required a double exponential rate equation, which assumes the presence of a lag (smooth cyan curve, illustrated on an expanded scale in the inset). By contrast, the corresponding transient produced by mixing with ADP (red jagged curve) could be adequately fit with a single exponential process (smooth green curve, illustrated on an expanded scale in the inset). B, for both ATP and ADP, the rate constant for the rising phase varied hyperbolically with nucleotide concentration, defining maximum rate constants of 10.2 ± 0.3 s−1 for ATP (blue) and 13.8 ± 0.9 s−1 for ADP (red). Each point and bar represents the mean of four independent measurements ± 1 S.D. Conditions were as follows: 100 mm KCl, 25 mm HEPES, 2 mm MgCl2, 1 mm EGTA, pH 7.50, 20 °C.

