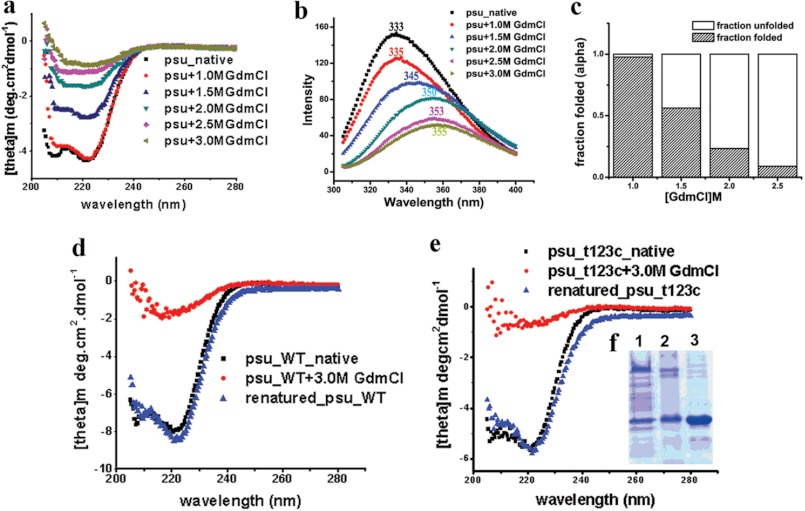
FIGURE 5.
Biophysical characterization of Psu knot. a, far-UV CD spectra of Psu at different GdmCl concentration. b, fluorescent emission spectra of Psu at 340 nm, using an excitation at 295 nm with concentrations of GdmCl varied similar to CD experiments. c, bar diagram showing folded fractions of Psu-WT at different GdmCl concentrations. d–e, comparison of native, denatured (3 m GdmCl) and renatured (0.26 m GdmCl) Psu-WT (d) and T123C-ΔCys-Psu (e). f, lane 1, 15% SDS-PAGE of renatured T123C-ΔCys-Psu treated with copper phenanthroline; lane 2, T123C-ΔCys-Psu treated with copper phenanthroline; lane 3, native T123C-ΔCys-Psu.

