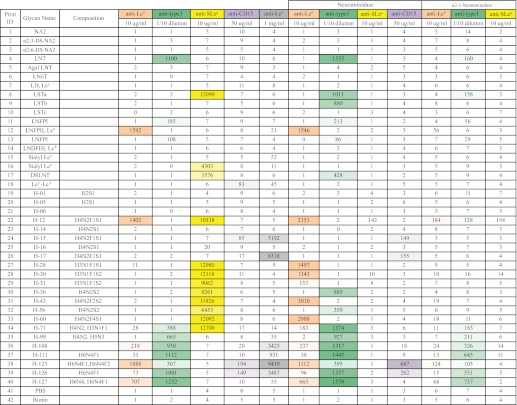
TABLE 2.
Heat map of antibody-binding data for structural analysis
A heat map summary of the binding data from analyses of the HMG subarray with different defined antibodies before and after specific exoglycosidase digestion(s) is shown. A total of 40 glycans were printed on the HMG subarray, including 18 control glycans and 22 selected HMGs. The color-coded numbers highlight the binding intensity (the darker the color, the higher the binding intensity). The color scale for the Excel spreadsheet was set using 0 as minimum and 1,500 RFU as maximum for anti-Lea, anti-type 1 and anti-CD15 antibodies and 0 as minimum and 10,000 RFU as maximum for anti-SLea and Lex antibodies. The untreated HMG subarrays were tested with five antibodies. The HMG subarrays treated with non-specific neuraminidase were interrogated with anti-Lea, anti-type 1, anti-SLea, anti-CD15, and the HMG-subarrays treated with α2-3-specific neuraminidase were interrogated with anti-Lea, anti-type 1, and anti-SLea.

