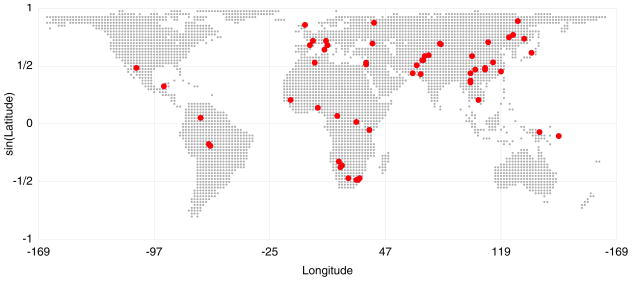
Figure 1.
Geographic locations of populations in the HGDP-CEPH Cell Line Panel. If a range of latitude and longitude coordinates was specified by Cann et al. (2002) for a given population, the population was plotted at the centroid of the range (mean of the longitudes, inverse sine of the mean of the sines of the latitudes). Except where otherwise specified, this article utilizes the exact microsatellite dataset of Rosenberg et al. (2005), a collection of 783 autosomal microsatellites in 1048 individuals from 53 populations. The map indicates 58 populations, some pairs of which overlap precisely in location, but six Bantu groups from southern Africa are grouped into a single population for the analysis. When the populations are split into regions, unless otherwise specified, the regions include sub-Saharan Africa, Europe, the Middle East (and North Africa), Central/South Asia, East Asia, Oceania, and the Americas.

