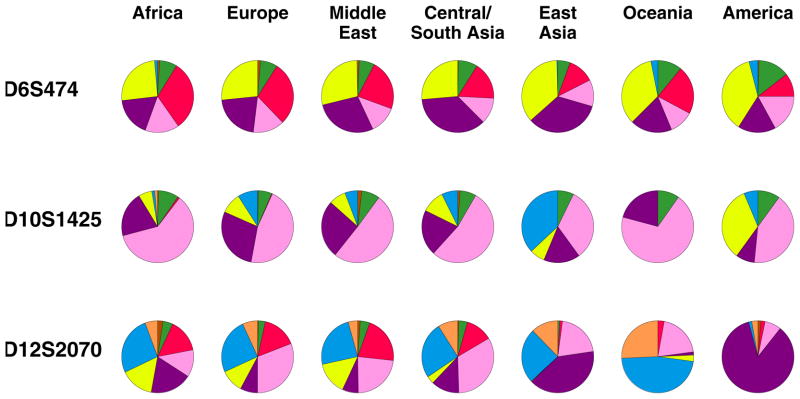
Figure 3.
Allele frequencies at three microsatellite loci. Each of the three loci has exactly eight alleles, which are displayed counterclockwise from the top of each pie chart in the following sequence of colors, proceeding in increasing order of allele size: orange, blue, yellow, purple, pink, red, green, brown. In most of the pie charts, one or more alleles is rare or absent.

