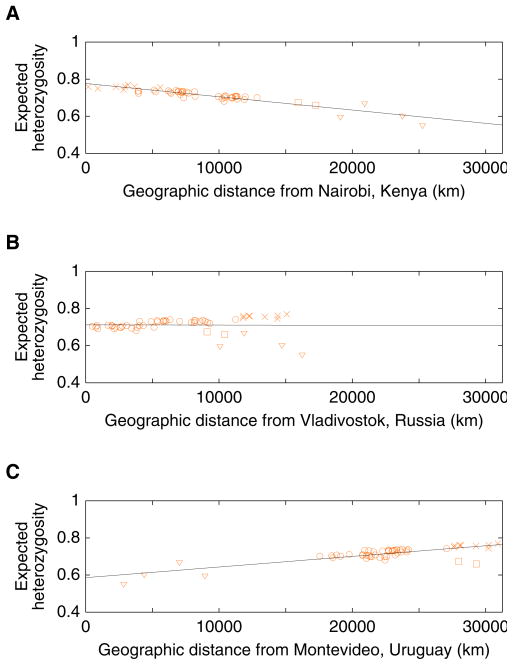
Figure 7.
Heterozygosity of populations as a function of geographic distance from particular points: (A) Nairobi, Kenya (1.26666667oS 36.8°E); (B) Vladivostok, Russia (43.13333333°N 131.91666667°E); (C) Montevideo, Uruguay (34.88333333°S 56.18333333°W). For each locus and population, expected heterozygosity was computed as , where n denotes the number of alleles in the sample and pi denotes the sample frequency of distinct allele i in the population. The mean heterozygosity across loci was then computed. Geographic coordinates for populations were obtained as in Figure 1, and great-circle geographic distances between populations were computed as in Rosenberg et al. (2005), forcing paths between pairs of points to travel through the five waypoints described in Ramachandran et al. (2005). Paths to the Americas all passed through 64°N 177°E and 54°N 130°W, paths to Oceania through 11°N 104°E, and paths to Africa through 30°N 31°E; paths from Europe to Africa, the Middle East, or Oceania also passed through 41°N 28°E. As in Ramachandran et al. (2005), the Bantu samples from southern Africa were split into Southwestern Bantu (Herero, Ovambo) and Southeastern Bantu (Pedi, Sotho, Tswana, Zulu) groups, and the Surui were omitted (for the Southwestern and Southeastern Bantus, the coordinates used were the mean of the longitudes and the inverse sine of the mean of the sines of the reported locations of included individuals). The four Native American populations are marked with triangles, the two populations from Oceania with squares, and the eight sub-Saharan African populations with crosses. The remaining populations, from Europe, Asia, and northern Africa, are marked with circles. Denoting geographic distance in thousands of kilometers by D, the regression lines are H=0.770–0.00716D, H=0.712+(9.97×10⁻⁵)D, and H=0.586+0.00574D, for (A), (B), and (C), with coefficients of determination (R2) equal to 0.865, 1.16×10⁻⁴, and 0.662, respectively.

