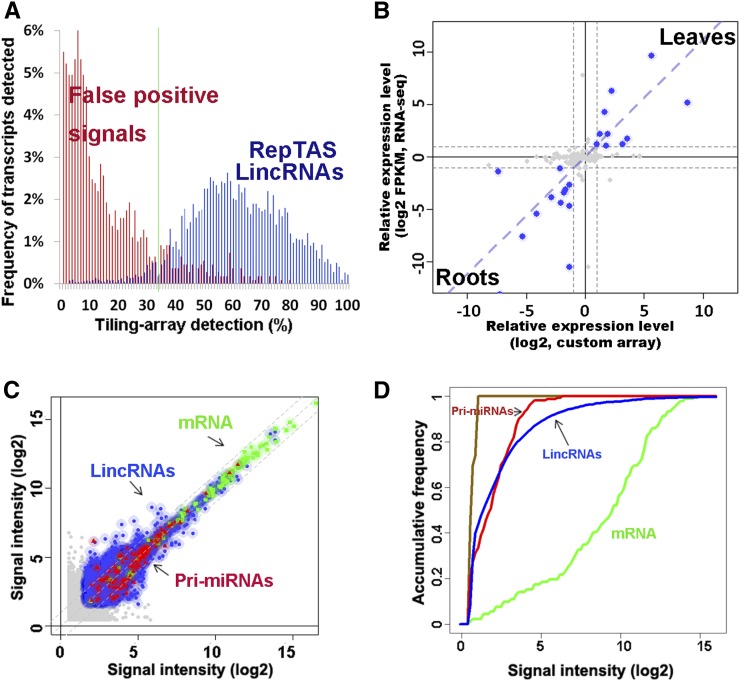
Figure 2.
Detection of Arabidopsis lincRNAs by RepTAS and ATH lincRNA v1 Arrays.
(A) Distribution in 200 tiling arrays of lincRNAs detected by RepTAS. Blue bars show predicted lincRNAs, whereas red bars show 85 to ∼140-nucleotide signal peaks or partial transcripts detected by only two neighboring positive probes. Such partial transcripts were considered to be false positives. See Methods for details.
(B) Changes of lincRNA expression levels in roots and leaves detected by custom array and RNA-seq. lincRNAs with more than twofold change in expression level are represented by blue solid circles. Gray dashed lines show a twofold change in expression level. FPKM, fragments per kilobase of exon per million fragments mapped (Cabili et al., 2011).
(C) Expression levels of lincRNAs, pri-miRNAs, and mRNAs in two independent flower samples detected by ATH lincRNA v1 arrays. The x axis and y axis give log2 values of signal intensity detected in two biological replicates. Blue solid circles, lincRNAs; green squares, mRNAs; red triangles, pri-miRNAs; and gray solid circles, lincRNAs with signal intensities below the background value. Shadow shows the range of twofold change in signal intensity of each transcript.
(D) Accumulative distribution of lincRNA, pri-miRNA, and mRNA expression levels detected by ATH lincRNA v1 arrays. Green, mRNAs; red, lincRNAs; blue, pri-miRNAs; and brown, negative control probes. Average signal values of two independent flower samples are given.

