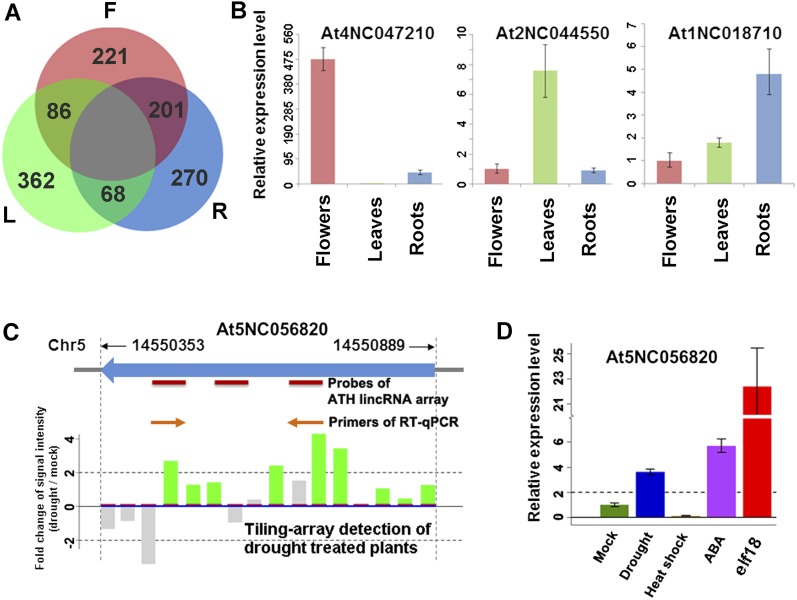
Figure 3.
Expression Profiles of lincRNAs in Different Arabidopsis Plant Organs and in Response to Biotic and Abiotic Stresses.
(A) A Venn diagram showing preferential expression of lincRNAs in different organs. F, flowers; L, leaves; and R, roots.
(B) Organ preferential expression of three selected lincRNAs. Relative expression levels of lincRNAs were measured by qRT-PCR. Other examples are shown in Supplemental Data Set 12 online.
(C) and (D) Detection and experimental verification of At5NC056820, a predicted lincRNA. Expression levels are given with sd bars (n = 3). Note that At5NC056820 was highly induced by elf18 and moderately induced by ABA and drought treatment.
[See online article for color version of this figure.]

