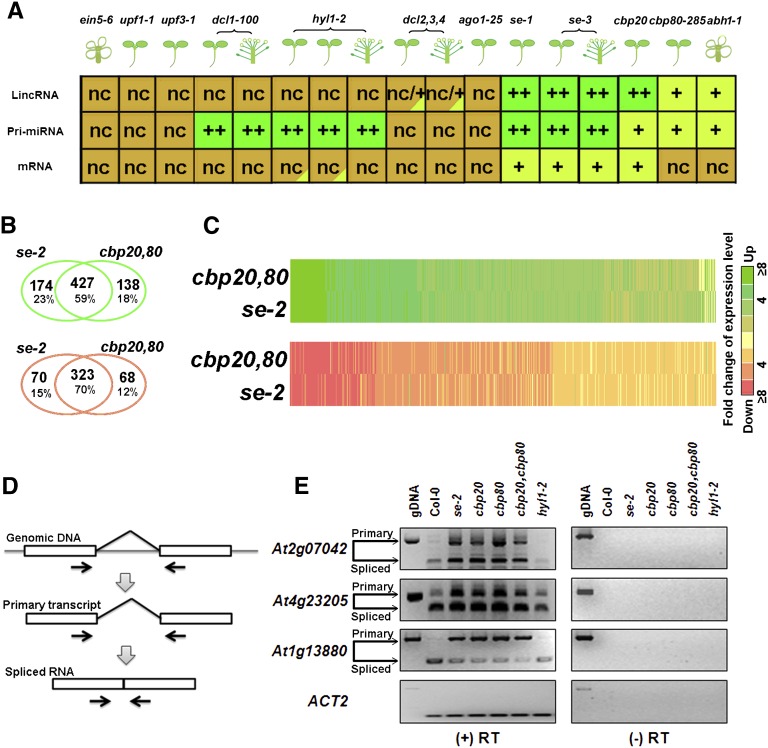
Figure 4.
Global Changes of Expression Levels of Three Transcript Categories in 11 Arabidopsis Mutants.
(A) Global changes of transcript levels in 11 mutants compared with the wild type. Plant organs are shown in cartoon formats. Dark-green “++” shows highly upregulated transcripts compared with the wild type. Light-green “+” shows slightly upregulated transcripts compared with the wild type. Red “-” shows downregulated transcripts compared with the wild type. Brown “nc” indicates no change.
(B) A Venn diagram of upregulated (green) and downregulated (red) lincRNAs in se-2 and cbp20/80 double mutant.
(C) Heat maps of 734 lincRNAs in se-2 and the cbp20/80 double mutant. Data in (B) were used for this analysis.
(D) Detection of lincRNA splicing using RT-PCR. Primers of PCR/RT-PCR are shown by arrows.
(E) Two intron retention events in two lincRNAs (AT2G07042 and AT4G23205) detected by RT-PCR in se, cbp20, cbp80, and the cbp20/80 double mutant. We used hyl1-2 as a negative control of splicing regulated by SE, CBP20, and CBP80. The AT1G13880 is an mRNA previously shown to be regulated by SE, CBP20, and CBP80 (Laubinger et al., 2008); this served as a positive control. RT-PCR products were verified by sequencing. gDNA, genomic DNA.

