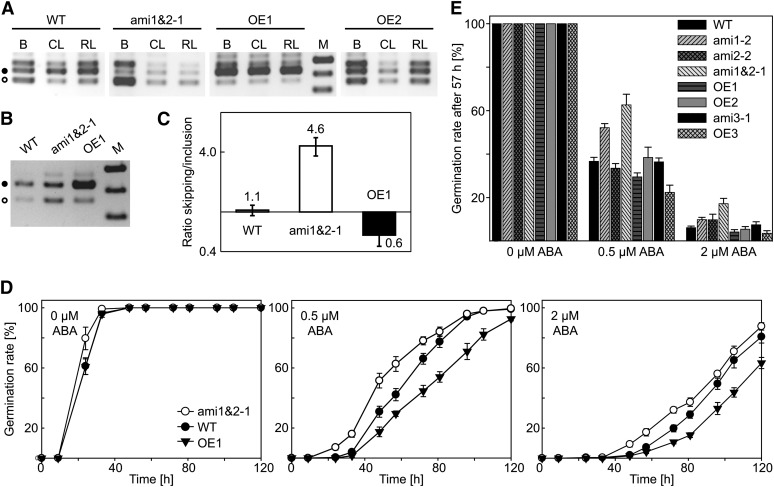
Figure 6.
Altered At-PTB Levels Correlate with Changes in PIF6 Splicing and ABA-Dependent Seed Germination.
(A) RT-PCR analysis of PIF6 splicing patterns in the wild-type (WT) and the indicated PTB misexpression lines for buds (B), cauline leaves (CL), and rosette leaves (RL). M designates marker, and displayed bands correspond to 500, 400, and 300 bp. Black and open circles indicate bands derived from the exon inclusion and skipping variant, respectively.
(B) and (C) RT-PCR analysis of PIF6 splicing in dry seeds from the indicated genotypes. Marker and symbols are as described for (A). RT-PCR products from three independent replicates were quantified using a bioanalyzer (C). Displayed data are mean values ± sd.
(D) Germination assays of wild-type, ami1&2, and OE1 seed in the absence (left panel) or presence of 0.5 µM (middle) or 2 µM (right) ABA in the medium. Data are mean values from three independent experiments and total six replicates; error bars show se.
(E) Germination rates of the indicated genotypes 57 h after transfer of the seeds to light in the absence or presence of ABA in the medium. Data are mean values from three independent experiments and total six replicates (17 replicates for the wild-type); error bars show se.

