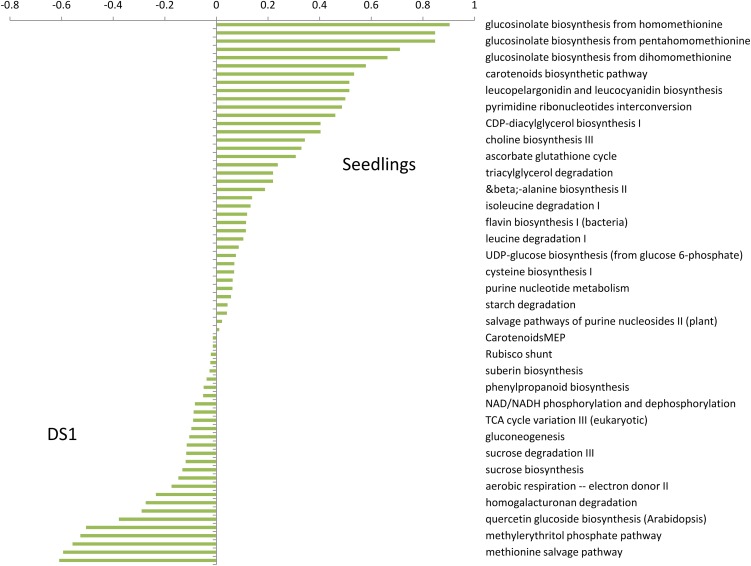
Figure 3.
The Difference in AUSR Scores between the Seedlings Data Set and the Combined Seedlings and Tissues Data Sets (DS1).
Each column represents a difference in the AUSR score for one of the 66 tested pathways. The modules used here were created by Matisse* (see Methods) with the MD network.
[See online article for color version of this figure.]

