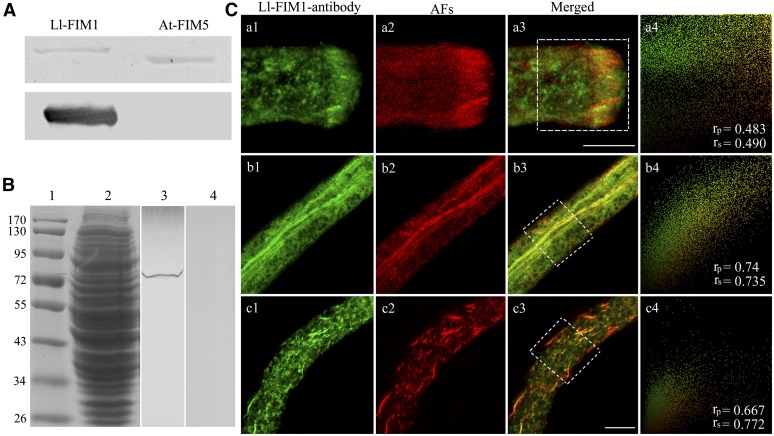
Figure 2.
FIM1 Colocalizes with Actin Filaments in Lily Pollen Tubes.
(A) Immunoblot analysis showed that the antibody specifically recognized recombinant Ll-FIM1 but did not recognize recombinant At-FIM5. The top image shows a Coomassie blue–stained gel of recombinant Ll-FIM1 and At-FIM5, respectively; the bottom image shows the corresponding protein gel blot probed with the affinity-purified anti-Ll-FIM1 antibody.
(B) Immunoblot analysis showed that the antibody specifically recognized FIM1 from the protein extracts of lily pollen tubes. Marker, lane 1; Coomassie blue–stained gel of the protein extracts of pollen tubes, lane 2; the corresponding protein gel blot probed with affinity-purified anti-Ll-FIM1 antibody, lane 3; and preimmune serum, lane 4.
(C) Dual-fluorescence localization with Ll-FIM1 antibody (a1, b1, and c1) and phalloidin (a2, b2, and c2) in lily pollen tubes. Actin was observed as the red fluorescence of phalloidin and Ll-FIM1 as the green fluorescence of fluorescein isothiocyanate. The images are projections. (a1) Ll-FIM1 protein was focused in the subapex of the pollen tube; (b1) Ll-FIM1 protein was visible on large bundles along the shank of the pollen tube; (c1) the distribution of Ll-FIM1 protein after treatment with LatB; (a2) and (b2) The distribution of actin filaments (AFs) in lily pollen tube; (c2) AFs became fragmented after treatment with LatB; (a3), (b3), and (c3) overlay images showed that the Ll-FIM1 protein colocalized with AFs in lily pollen tubes. Intensities of fluorescent signals from the hatched boxes in (a3), (b3), and (c3) are depicted in a scatterplot at the right side of each row (a4, b4, and c4), and the calculated PSC values are given in the bottom right corner. The two signals showed strong colocalization. Bars = 10 µm.

