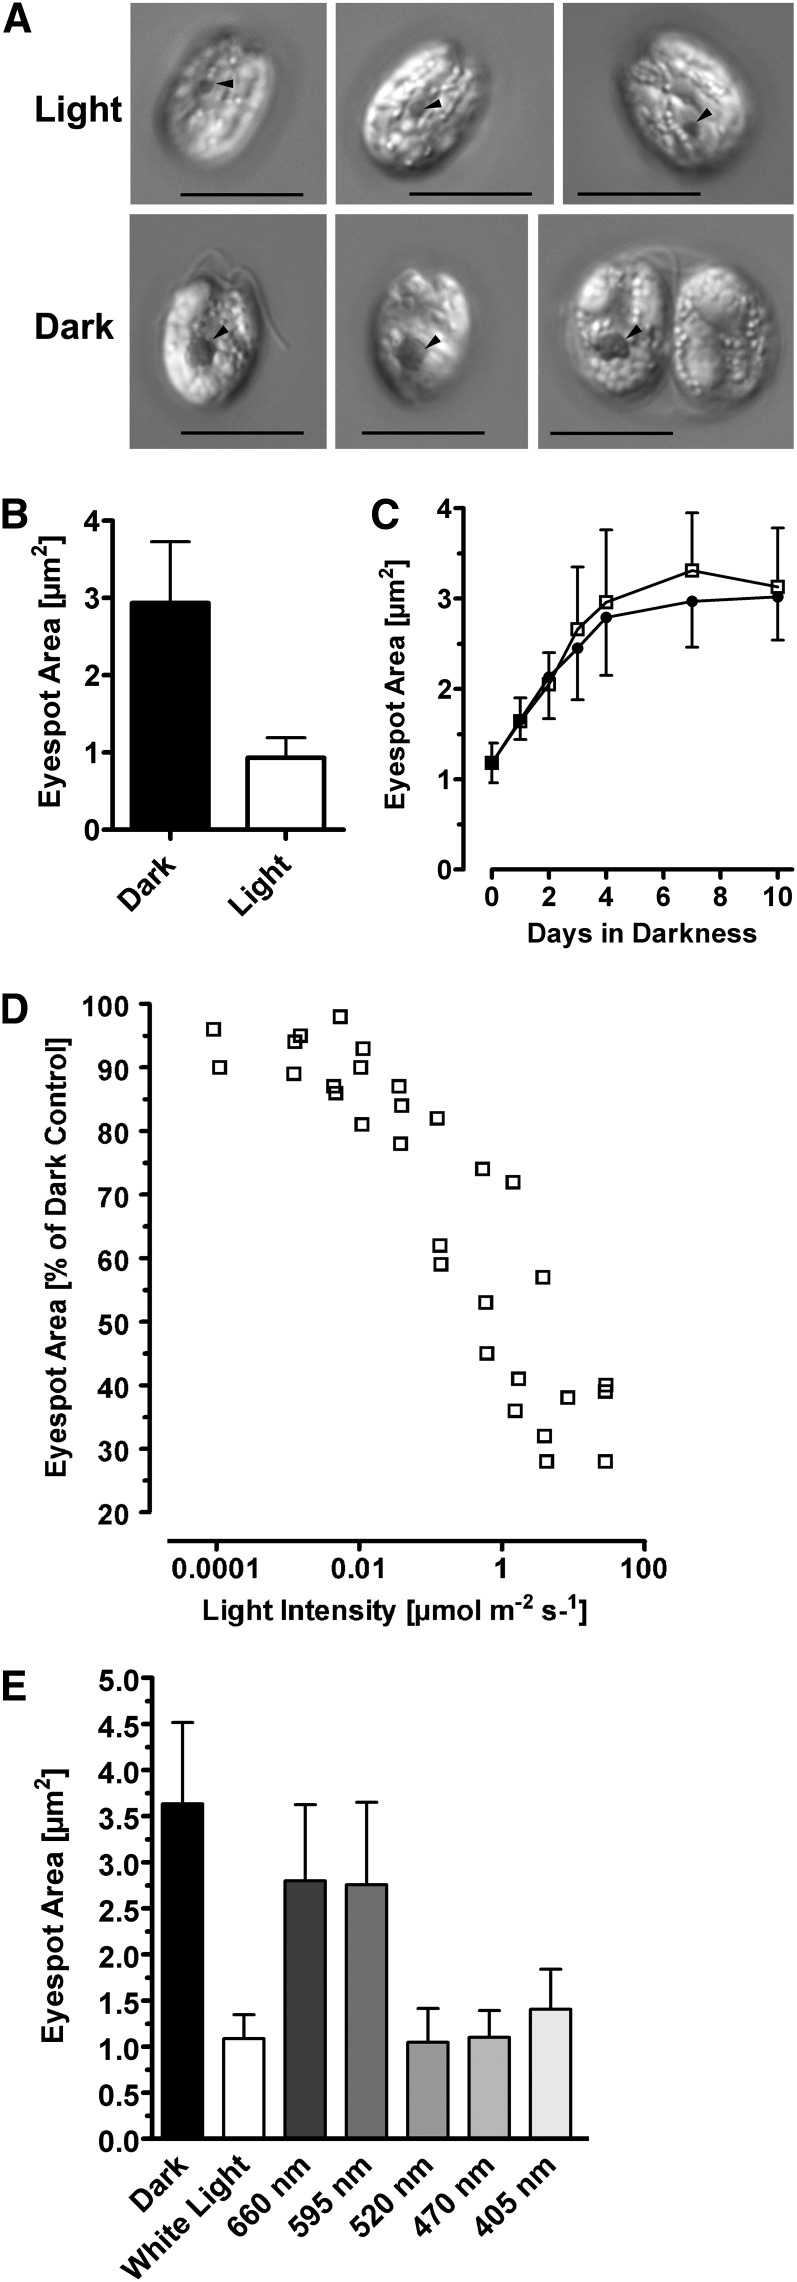
Figure 1.
The Actual Eyespot Size of the Prasinophyte T. astigmatica Depends on Ambient Light Intensity during Growth.
(A) Differential interference contrast images of cells grown for 14 d in artificial seawater supplemented with Glc and yeast extract, either under a 14/10-h light/dark cycle (40 to 60 µmol photons m−2 s−1) or in complete darkness. Arrowheads = eyespot. Bars = 10 µm.
(B) Quantification of the eyespot area of dark- and light-grown T. astigmatica cells. Growth conditions same as in (A). Mean ± sd; n = 37 cells. Difference is highly significant (Student’s t test, P < 0.0001).
(C) Eyespot size increases in darkness, independent from cell growth. Cells were grown in either plain artificial seawater (filled circles) or artificial seawater supplemented with Glc and yeast extract (open squares), which allowed population growth. Cell densities were 2.2 to 2.5 × 10⁵ cells mL−1 at the start and 2.9 × 10⁵ cells mL−1 (no additions) and 1.7 × 10⁶ cells mL−1 (Glc + yeast extract) at the end. Mean ± sd; n = 35 to 37 cells. Values obtained for the eyespot sizes were not significantly different (Studenťs t test, P = 0.4003).
(D) Cultures were grown for 22 d at the indicated light intensities of white light in a 14/10-h light/dark cycle. Each data point represents the mean eyespot area of 35 to 90 cells. For clarity, sd is not shown. Light intensities > 0.015 µmol photons m−2 s−1 represent measured values; values below that were calculated using the measured values, at 537 nm, of LOT neutral density filters.
(E) Spectral dependence of the eyespot size reduction. Cells were grown at the indicated wavelengths as described in (D). Light intensities varied between 12 and 80 µmol photons m−2 s−1. For each wavelength, 53 to 87 cells were analyzed. Mean ± sd; differences are significant (one-way ANOVA, P < 0.0001).

