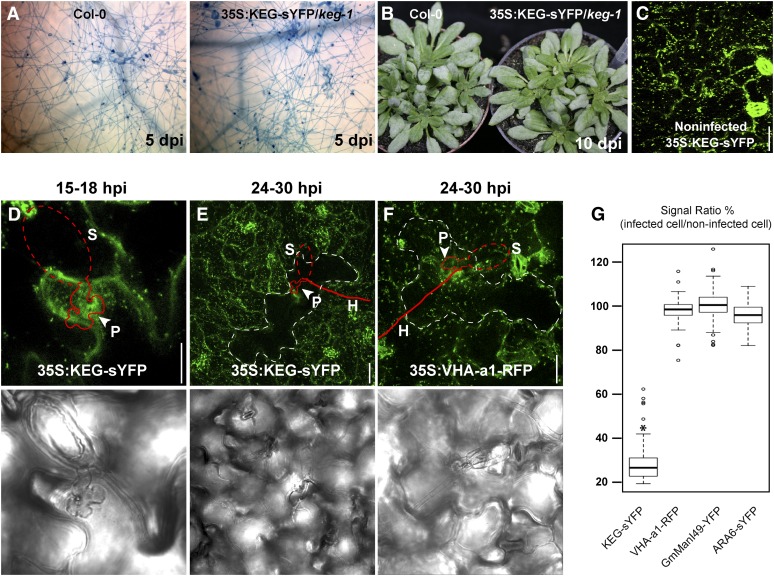
Figure 7.
KEG Is Specifically Degraded in Powdery Mildew Infected Cells.
(A) Trypan blue staining of G. cichoracearum fungal hyphae on Arabidopsis leaves 5 d postinoculation (dpi). Col-0, Columbia-0.
(B) Fungal growth on 4-week-old plants at 10 d postinoculation.
(C) Distribution of KEG-sYFP in uninfected epidermal cells of transgenic Arabidopsis plants.
(D) Localization of KEG-sYFP to the penetration site of G. cichoracearum at 15 to 18 hpi.
(E) and (F) Specific degradation of KEG-sYFP (E) but not VHA-a1-RFP labeled TGN/EE (F) in G. cichoracearum infected cells at 24 to ∼30 hpi. White dashed lines outline cells penetrated by the fungus. Arrowheads indicate pathogen penetration sites, and red lines outline the penetrating fungus as observed by standard light microscopy in the bottom panels. H, hyphae; P, penetration site; S, spore. Each image is a Z-stack of six sections.
(G) Ratio of fluorescence signal in pathogen infected cells versus adjacent noninfected cells. The total fluorescence signal in each of 70 infected cells was measured for each transgenic line using NIH ImageJ and compared with the total fluorescence in an equal-sized field taken from adjacent noninfected cells. Results are provided as means with 25th and 75th percentiles (box) and range (whiskers). Statistical outliers are shown as circles. Asterisk denotes significantly different value from the three controls (P < 0.001; F test).
Bars = 20 μm.

