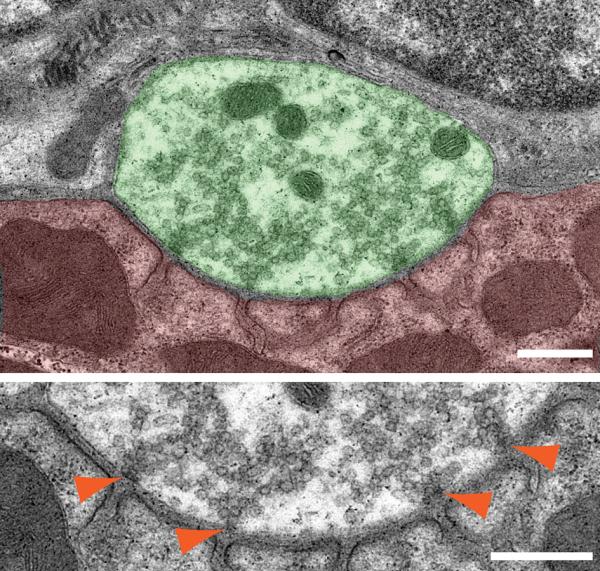
Figure 1.

A transmission electron micrograph showing active zones in a mouse NMJ. The top micrograph shows an NMJ profile of diaphragm from a wild-type mouse at postnatal day 85. The motor nerve terminal is colored in green and muscle in red. Synaptic vesicles are preferentially accumulating to four active zones. The bottom micrograph shows a high-magnification view of the presynaptic membrane area of the same NMJ. Orange arrowheads indicate electron-dense materials of the active zones that are accumulating synaptic vesicles and are aligned with postsynaptic junctional folds. Scale bars: 500nm.
