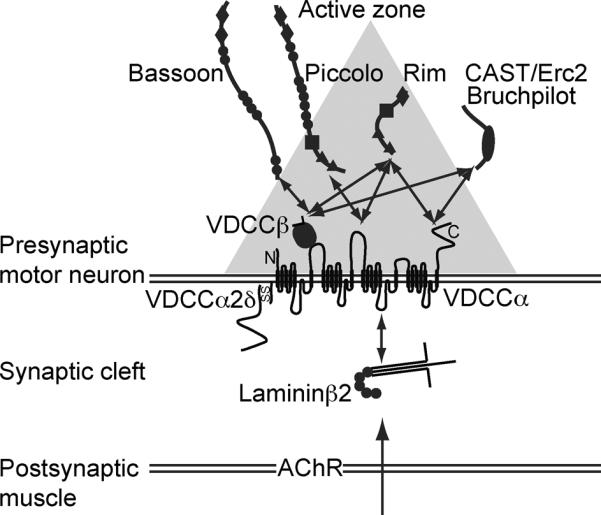
Figure 2.

A diagram of the molecular mechanism of active zone organization in mammalian neuromuscular junctions. The diagram depicts interactions between the muscle derived active zone organizer laminin β2, presynaptic voltage-dependent calcium channel (VDCC) subunits, and active zone proteins. The gray triangle depicts the electron dense material of an active zone detected by electron microscopy. Horizontal double lines show pre- and post-synaptic membranes, and the space between these lines represents the synaptic cleft. The sizes of the proteins and the synaptic cleft are not in scale. Two headed arrows represent some of the reported interactions.
