Figure 5.

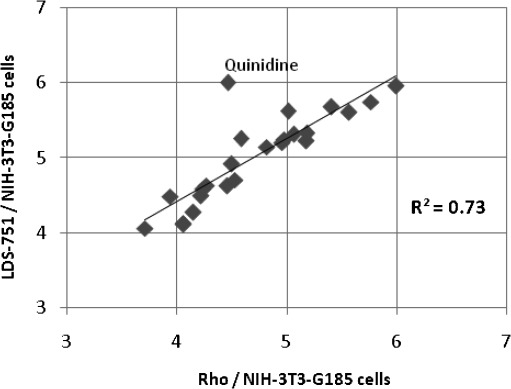
Bioactivity correlation plot: Inhibition of LDS transport vs. inhibition of Rho transport in NIH-3T3-G185 cells; units in pIC50.

Bioactivity correlation plot: Inhibition of LDS transport vs. inhibition of Rho transport in NIH-3T3-G185 cells; units in pIC50.