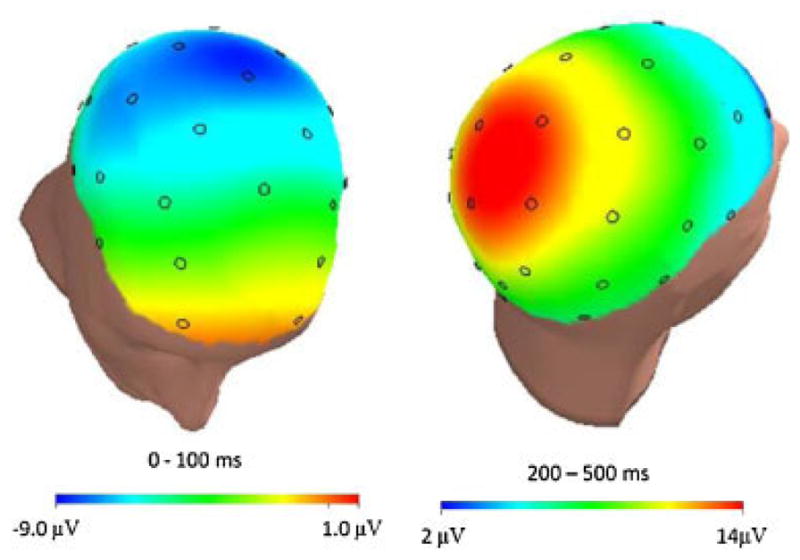
FIGURE 2.

Scalp distribution of the difference between error and correct responses in the time-range of the ERN (i.e., 0–100 ms; left) and PE (i.e., 200–500 ms; right). [Color figure can be seen in the online version of this article, available at http://wileyonlinelibrary.com/journal/dev]
