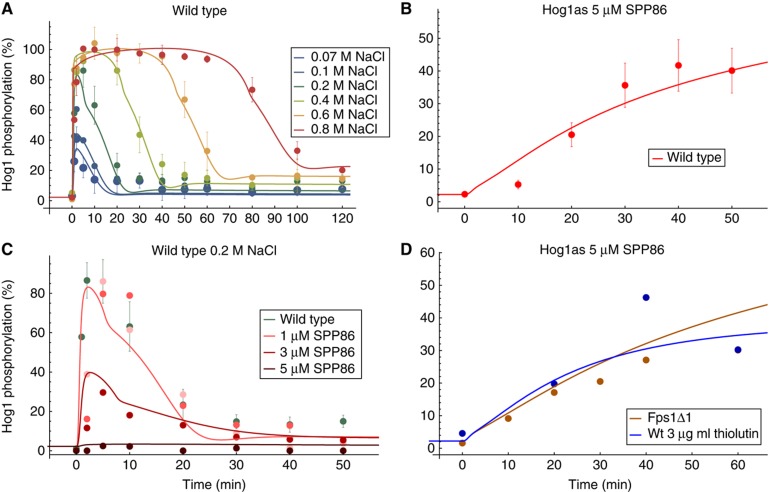
Figure 3.
Data and model predictions for the best approximating model. Data sets in panels (A, B) were included in the ranking procedure. (A) Hog1 phosphorylation of wild-type W303 for different osmotic shocks. (B) Hog1 phosphorylation of Hog1as wild type upon addition of 5 μM Hog1 inhibitor SPP86. (C) Hog1 phosphorylation of a Pbs2as mutant at 0.2 M NaCl and various inhibitor concentrations. The wild-type simulation (green line) is covered by the 1 μM SPP86 simulation (light red line). (D) Hog1 phosphorylation of Hog1as in a Fps1Δ1 mutant upon addition of 5 μM Hog1 inhibitor SPP86 (brown line) and Hog1 phosphorylation of Hog1as wild type upon addition of 5 μM Hog1 inhibitor SPP86 and 3 μg/ml thiolutin (blue line). All data from Macia et al (2009). The simulations for cellular components are corrected for volume change. All Hog1 phosphorylation data are comparable by their relative level and are scaled to the amount of the ste50Δ mutant at 10 min (Figure 2A). Source data is available for this figure in the Supplementary Information.

