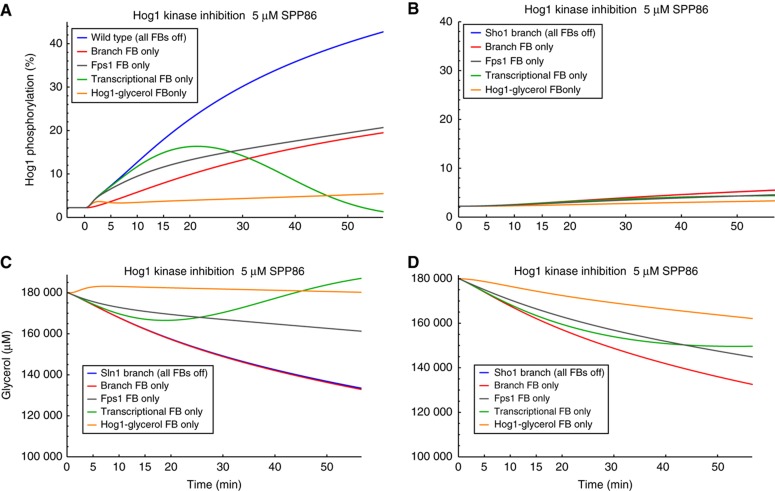
Figure 4.
Simulated Hog1 phosphorylation and corresponding intracellular glycerol concentrations. Shown are simulation scenarios, where all except one Hog1-mediated feedbacks (FBs) are blocked at time 0 by addition of 5 μM SPP86 kinase inhibitor in the absence of osmotic shock. Blue line: all FBs are blocked in the respective branch (see also Figure 2D). Red line: only Hog1 feedback on upstream signalling is kept active. Grey line: only Hog1 feedback on Fps1 closure is kept active. Green line: only Hog1-mediated transcription is kept active. Orange line: only Hog1-mediated glycerol production is kept active. (A) Hog1 phosphorylation time series for the Sln1 branch. (B) Hog1 phosphorylation time series for the Sho1 branch. (C) Glycerol time series for the Sln1 branch. (D) Glycerol time series for the Sho1 branch. In panels (B–D) the mutant simulation (blue line) is covered by the respective ‘branch FB only’-simulation (red line).

