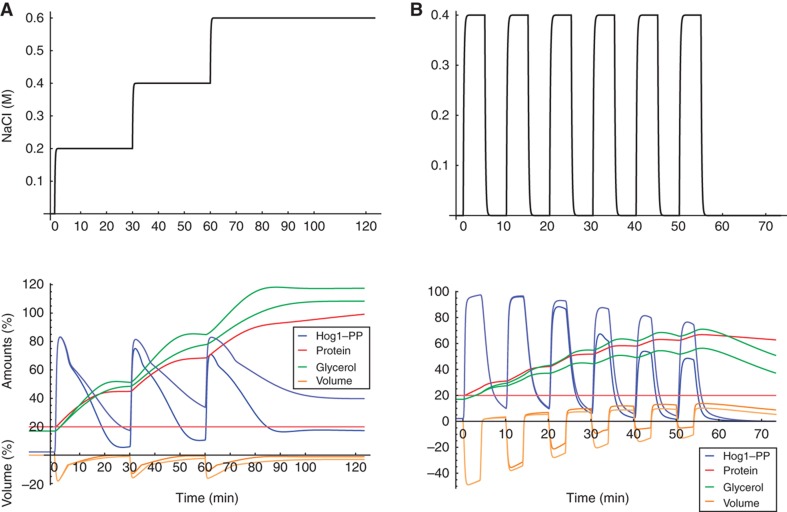
Figure 6.
Simulations for multiple consecutive osmotic shocks (A, left panels) and multiple hyper–hypo-osmotic shocks (B, right panels). The upper panels show the respective input osmotic shocks [M NaCl]. The lower panels show the respective simulations. The full and light-coloured lines show the corresponding model simulations with and without transcriptional feedback, respectively.

