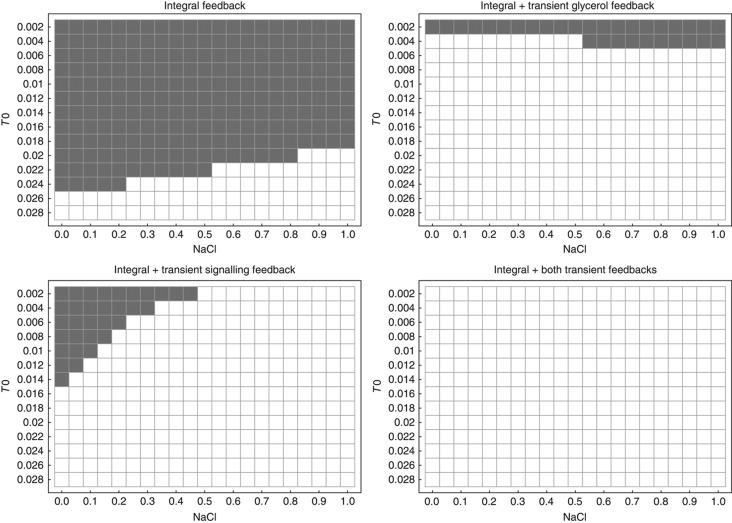
Figure 9.
Real parts of the maximum eigenvalues of the Jacobian matrix of the simplified HOG model from Figure 8 at steady state including different feedback mechanisms. Grey squares indicates maximum eigenvalues >0, that is, unstable steady states, white squares indicate maximum eigenvalues <0, that is, stable-steady states. Unstable steady states coincide with stable oscillations owing to a Hopf bifurcation, which was checked by a computational bifurcation analysis (see Supplementary Material and Supplementary Figure S5).

