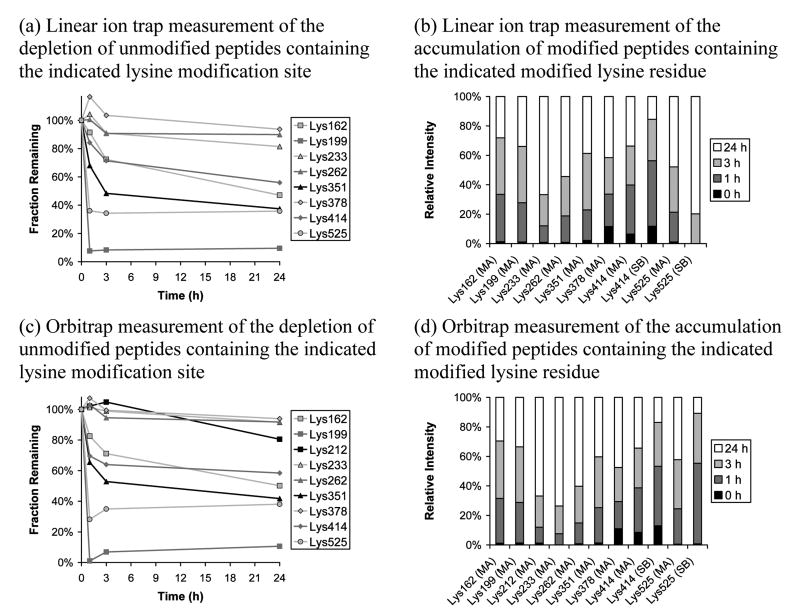
Figure 3.
Effect of varying reaction duration, at a fixed HNE:HSA ratio of 100:1, on reaction progress measured using iTRAQ reporter ion intensity for targeted lysine sites. Linear ion trap/PQD and Orbitrap/HCD data are presented. The targeted mass list was used. Depletion plots are scaled to 100% for the control while relative intensities are given in the accumulation bar plots. Relative abundance measurements were not obtained for Lys51 by either instrumental approach and were obtained for Lys212 only using the Orbitrap approach. MA indicates Michael addition while SB indicates Schiff base formation. When more than one unmodified peptide for a particular modification site was available, the most frequently-detected unmodified peptide was used.

