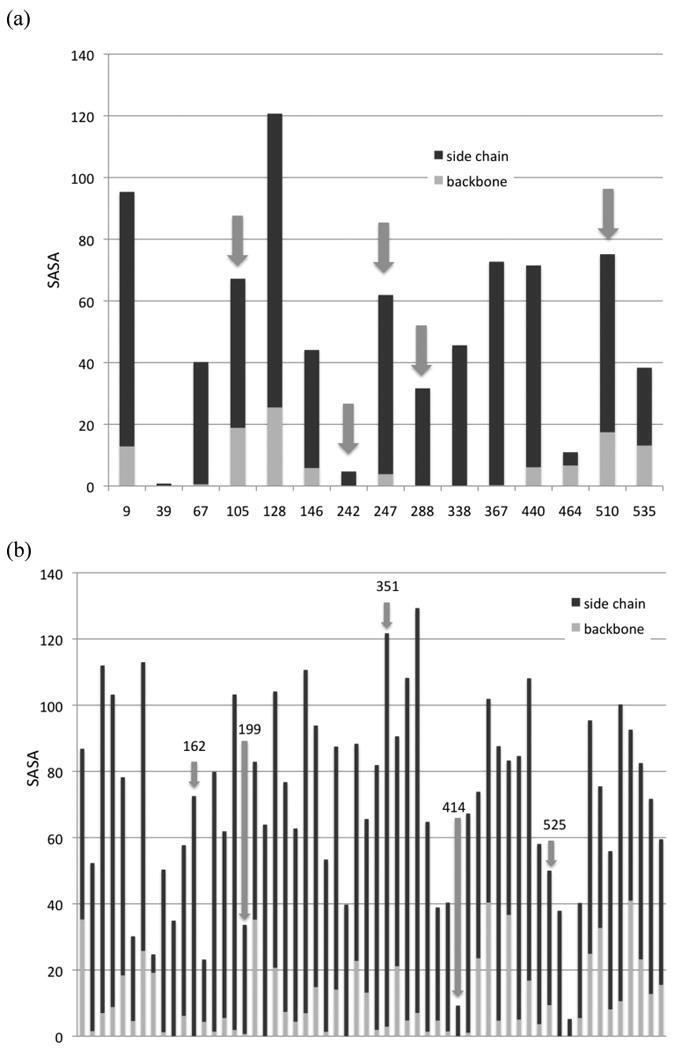
Figure 4.

SASA in Å2 for the (a) histidines and (b) lysines of HSA. Red bars are the backbones and blue bars are the side chains. Arrows indicate sites that were identified as being particularly reactive. In panel (b), the data is too extensive to include residue numbers, but highly reactive sites are labeled.
