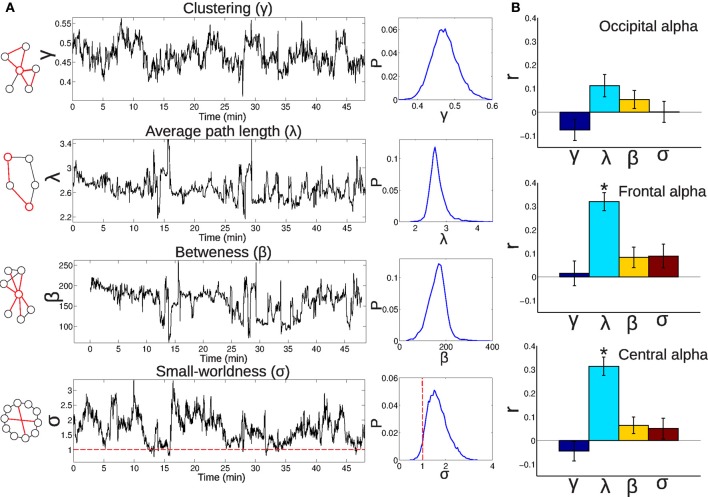
Figure 10.
(A) Left: Illustrations exemplifying the meaning of common graph metrics (clustering coefficient, average path length, betweeness, and small-worldness; for a detailed explanation, see the “Materials and Methods” section). Center: Examples showing the temporal evolution of the graph metrics for a single subject. Right: Probability (P) distributions (for all subjects) of the graph metric values. (B) Correlations between fluctuations in the graph metrics and EEG alpha power, averaged from occipital, frontal, and central electrodes (*significant at p<0.05, Bonferroni corrected, n = 72).

