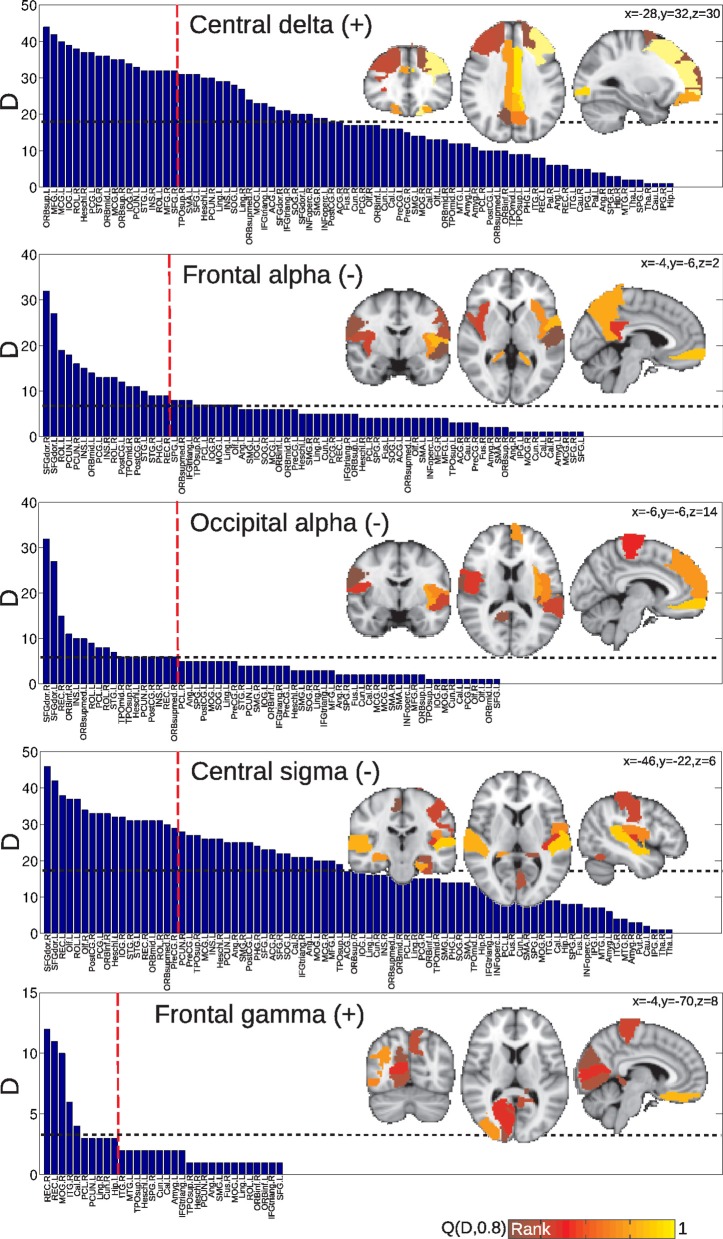
Figure 7.
Anatomical regions (or nodes) ranked according to the number of connections attached to them which correlate with EEG power fluctuations in different frequencies. In the inset, the regions corresponding to the top quintile of the distribution—denoted as Q(D, 0.8)—are displayed overlaid on a standard MNI T1 template. The horizontal dashed line indicates the mean of the distribution. Results are for the group of subjects undergoing vigilance transitions between wakefulness and light sleep.

