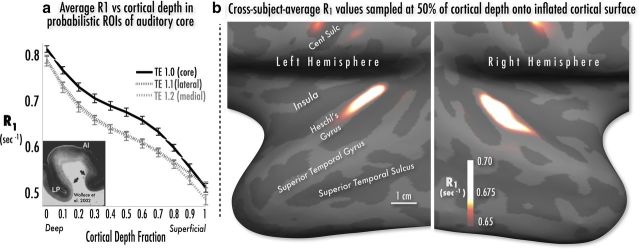
Figure 2.
a, Left, Relaxation rate (R1 sec−1) as function of cortical depth, averaged within probabilistically defined subdivisions of Brodmann's area 41 (TE1.0, TE1.1, and TE1.2 according to Morosan et al., 2001). Average R1 within TE1.0 (putative auditory core) decreases steeply from the gray/white boundary (depth fraction 0.0) to a tilted plateau at middle depths (0.3–0.6), then again drops steeply at superficial depths (0.7–1.0). Error bars indicate ±1 SEM over subjects. R1 within lateral (TE1.1) and medial (TE1.2) subdivisions shows a more gentle monotonic decrease from deep to superficial cortex. For comparison, the left inset is a myelin-stained section of human auditory core and belt cortex (from Wallace et al., 2002, contrast reversed) with a similar profile of myelination. b, Right, Group spherical average R1 values sampled at 50% of cortical depth and projected onto a single subject's left and right inflated hemispheric surfaces. The auditory core is visible in both hemispheres as a keyhole-shaped hyperintensity maximum running posteromedially to anterolaterally over the medial half of Heschl's gyrus. Hyperintensity maxima can also be observed within the densely myelinated pre- and post-central gyri.

