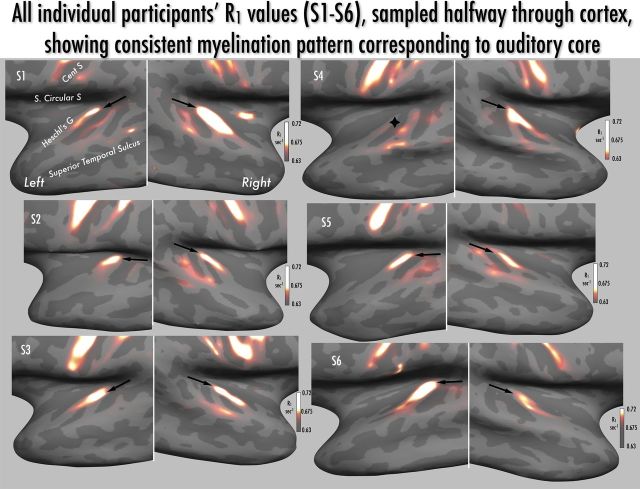
Figure 4.
Montage of individual participants' R1 maps, with values sampled halfway through cortex and projected onto the inflated surface of temporal and frontal lobes. As shown in the color bars, the range of projected R1 values is constant over participants, with the color scale slope adjusted slightly to show individual patterns of myelination. Keyhole-shaped regional increases in R1 oriented posteromedially to anterolaterally across Heschl's gyrus were observed in all hemispheres (medial-most aspect indicated by arrowhead) except the left hemisphere of participant S4 (marked with black diamond shape). R1 maxima are also observed along the pre- and post-central gyri within strongly myelinated presumptive primary motor and somatosensory regions. S. Circular S, superior circular sulcus of the insula; Cent S, central sulcus; Heschl's G, Heschl's gyrus.

